Description
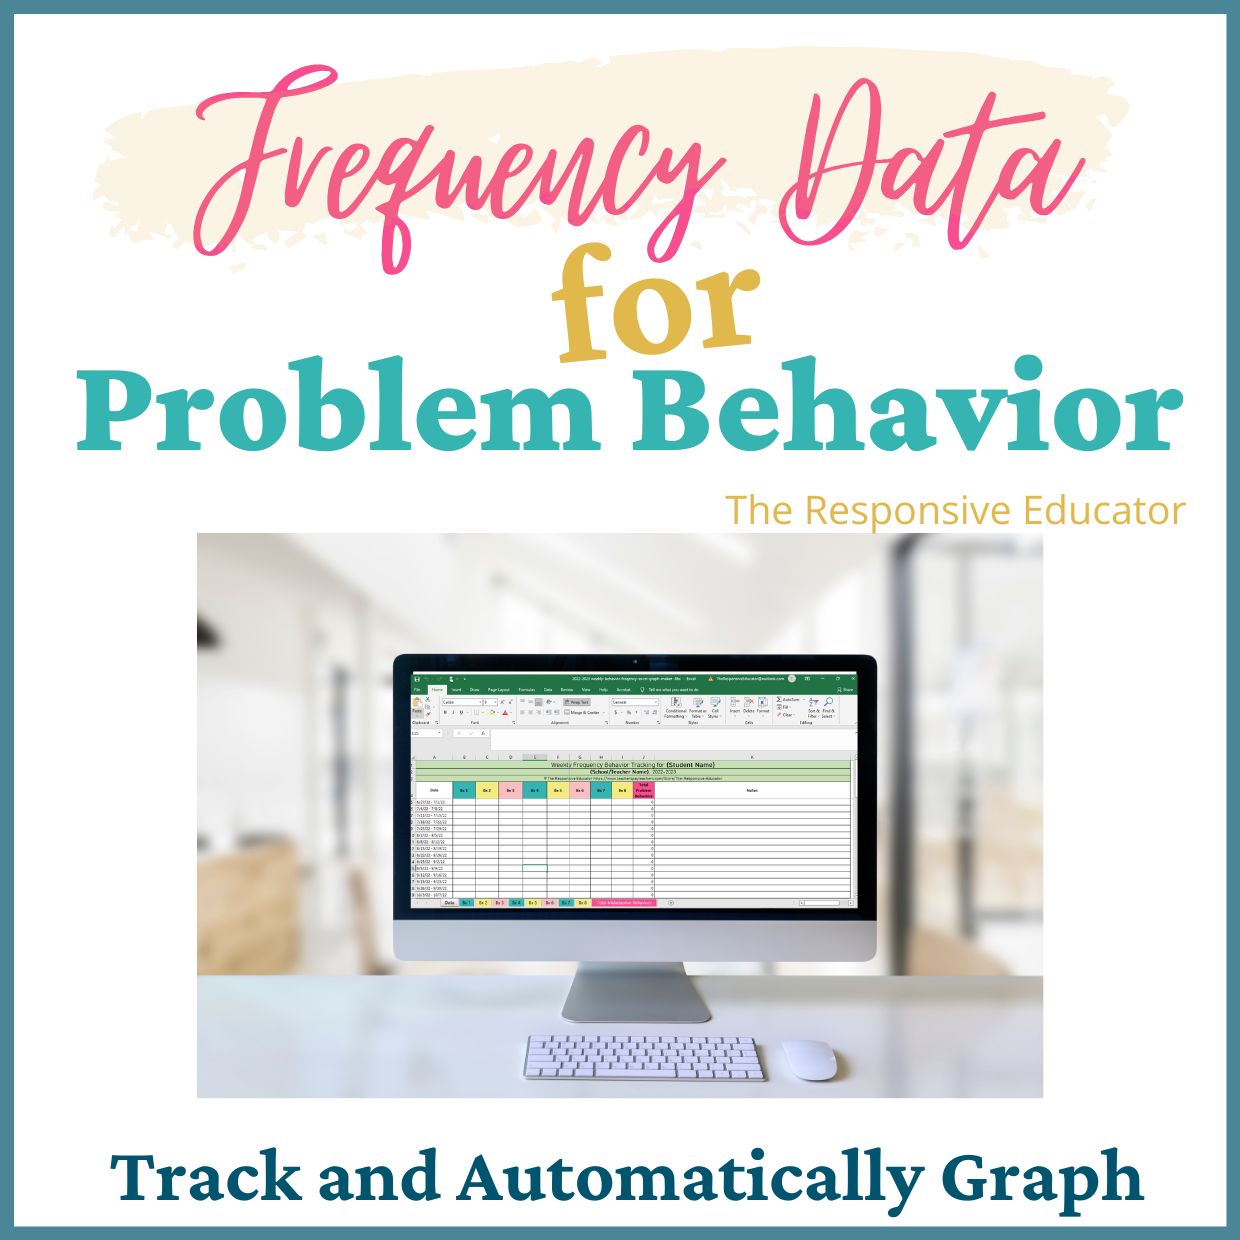
Frequency Behavior Data Sheet & Student Data Tracking Graph: Simple, Accurate Frequency Data for Behavior Monitoring
Collecting behavior data is necessary—but counting behaviors consistently and turning that information into something usable can feel overwhelming. Educators are often expected to track behavior frequency, monitor progress, and show trends over time, all while managing instruction and interventions.
The Frequency Behavior Data Sheet & Student Data Tracking Graph provide a clear, efficient way to record how often behaviors occur and automatically visualize patterns over time. This tool helps you move from raw counts to meaningful data you can use to guide interventions and monitor progress.
Instead of scattered notes or inconsistent tracking, this resource gives you a reliable system for frequency data collection.
When Frequency Data Is the Right Choice
Frequency tracking works best for behaviors that:
-
Have a clear beginning and end
-
Can be counted accurately
-
Occur multiple times throughout the day
Examples include calling out, leaving a seat, task refusal, or repeated peer behaviors.
Frequency data helps you:
-
Identify patterns in behavior
-
Measure changes over time
-
Determine whether interventions are effective
-
Support data-driven decision-making
What This Tool Helps You Do
-
Track how often a target behavior occurs
-
Monitor progress over time using clear graphs
-
Compare behavior data before and after interventions
-
Maintain consistent documentation for behavior planning and progress monitoring
What’s Included
-
Two Frequency Recording Forms
Designed for quick, consistent behavior counts -
Daily and Weekly Student Data Tracking Graphs
Editable spreadsheets available through the 2029–2030 school year -
Quick Overview of Common Data Collection Methods
Helps confirm when frequency tracking is the most appropriate option -
Quick Excel Tips
Makes data entry and graphing more efficient -
Example Behavior Graph
Includes a trend line and phase line to model best practice -
Step-by-Step Instructions
Clear guidance for entering and graphing frequency data
How to Use the Frequency Behavior Data Sheet
-
Select the frequency recording form that fits your setting.
-
Record the number of times the target behavior occurs.
-
Enter behavior counts into the daily or weekly tracking spreadsheet.
-
Review automatically generated graphs to identify trends and monitor progress.
Using Phase Lines to Strengthen Your Data
Phase lines allow you to document major changes that may affect behavior, such as:
-
New interventions
-
Medication changes
-
Schedule or classroom changes
-
Environmental or home-life factors
Instructions for adding phase lines are included.
Important Note:
This resource works in Excel and Google Sheets. However, phase lines can only be added in Excel, as this feature is not supported in Google Sheets.
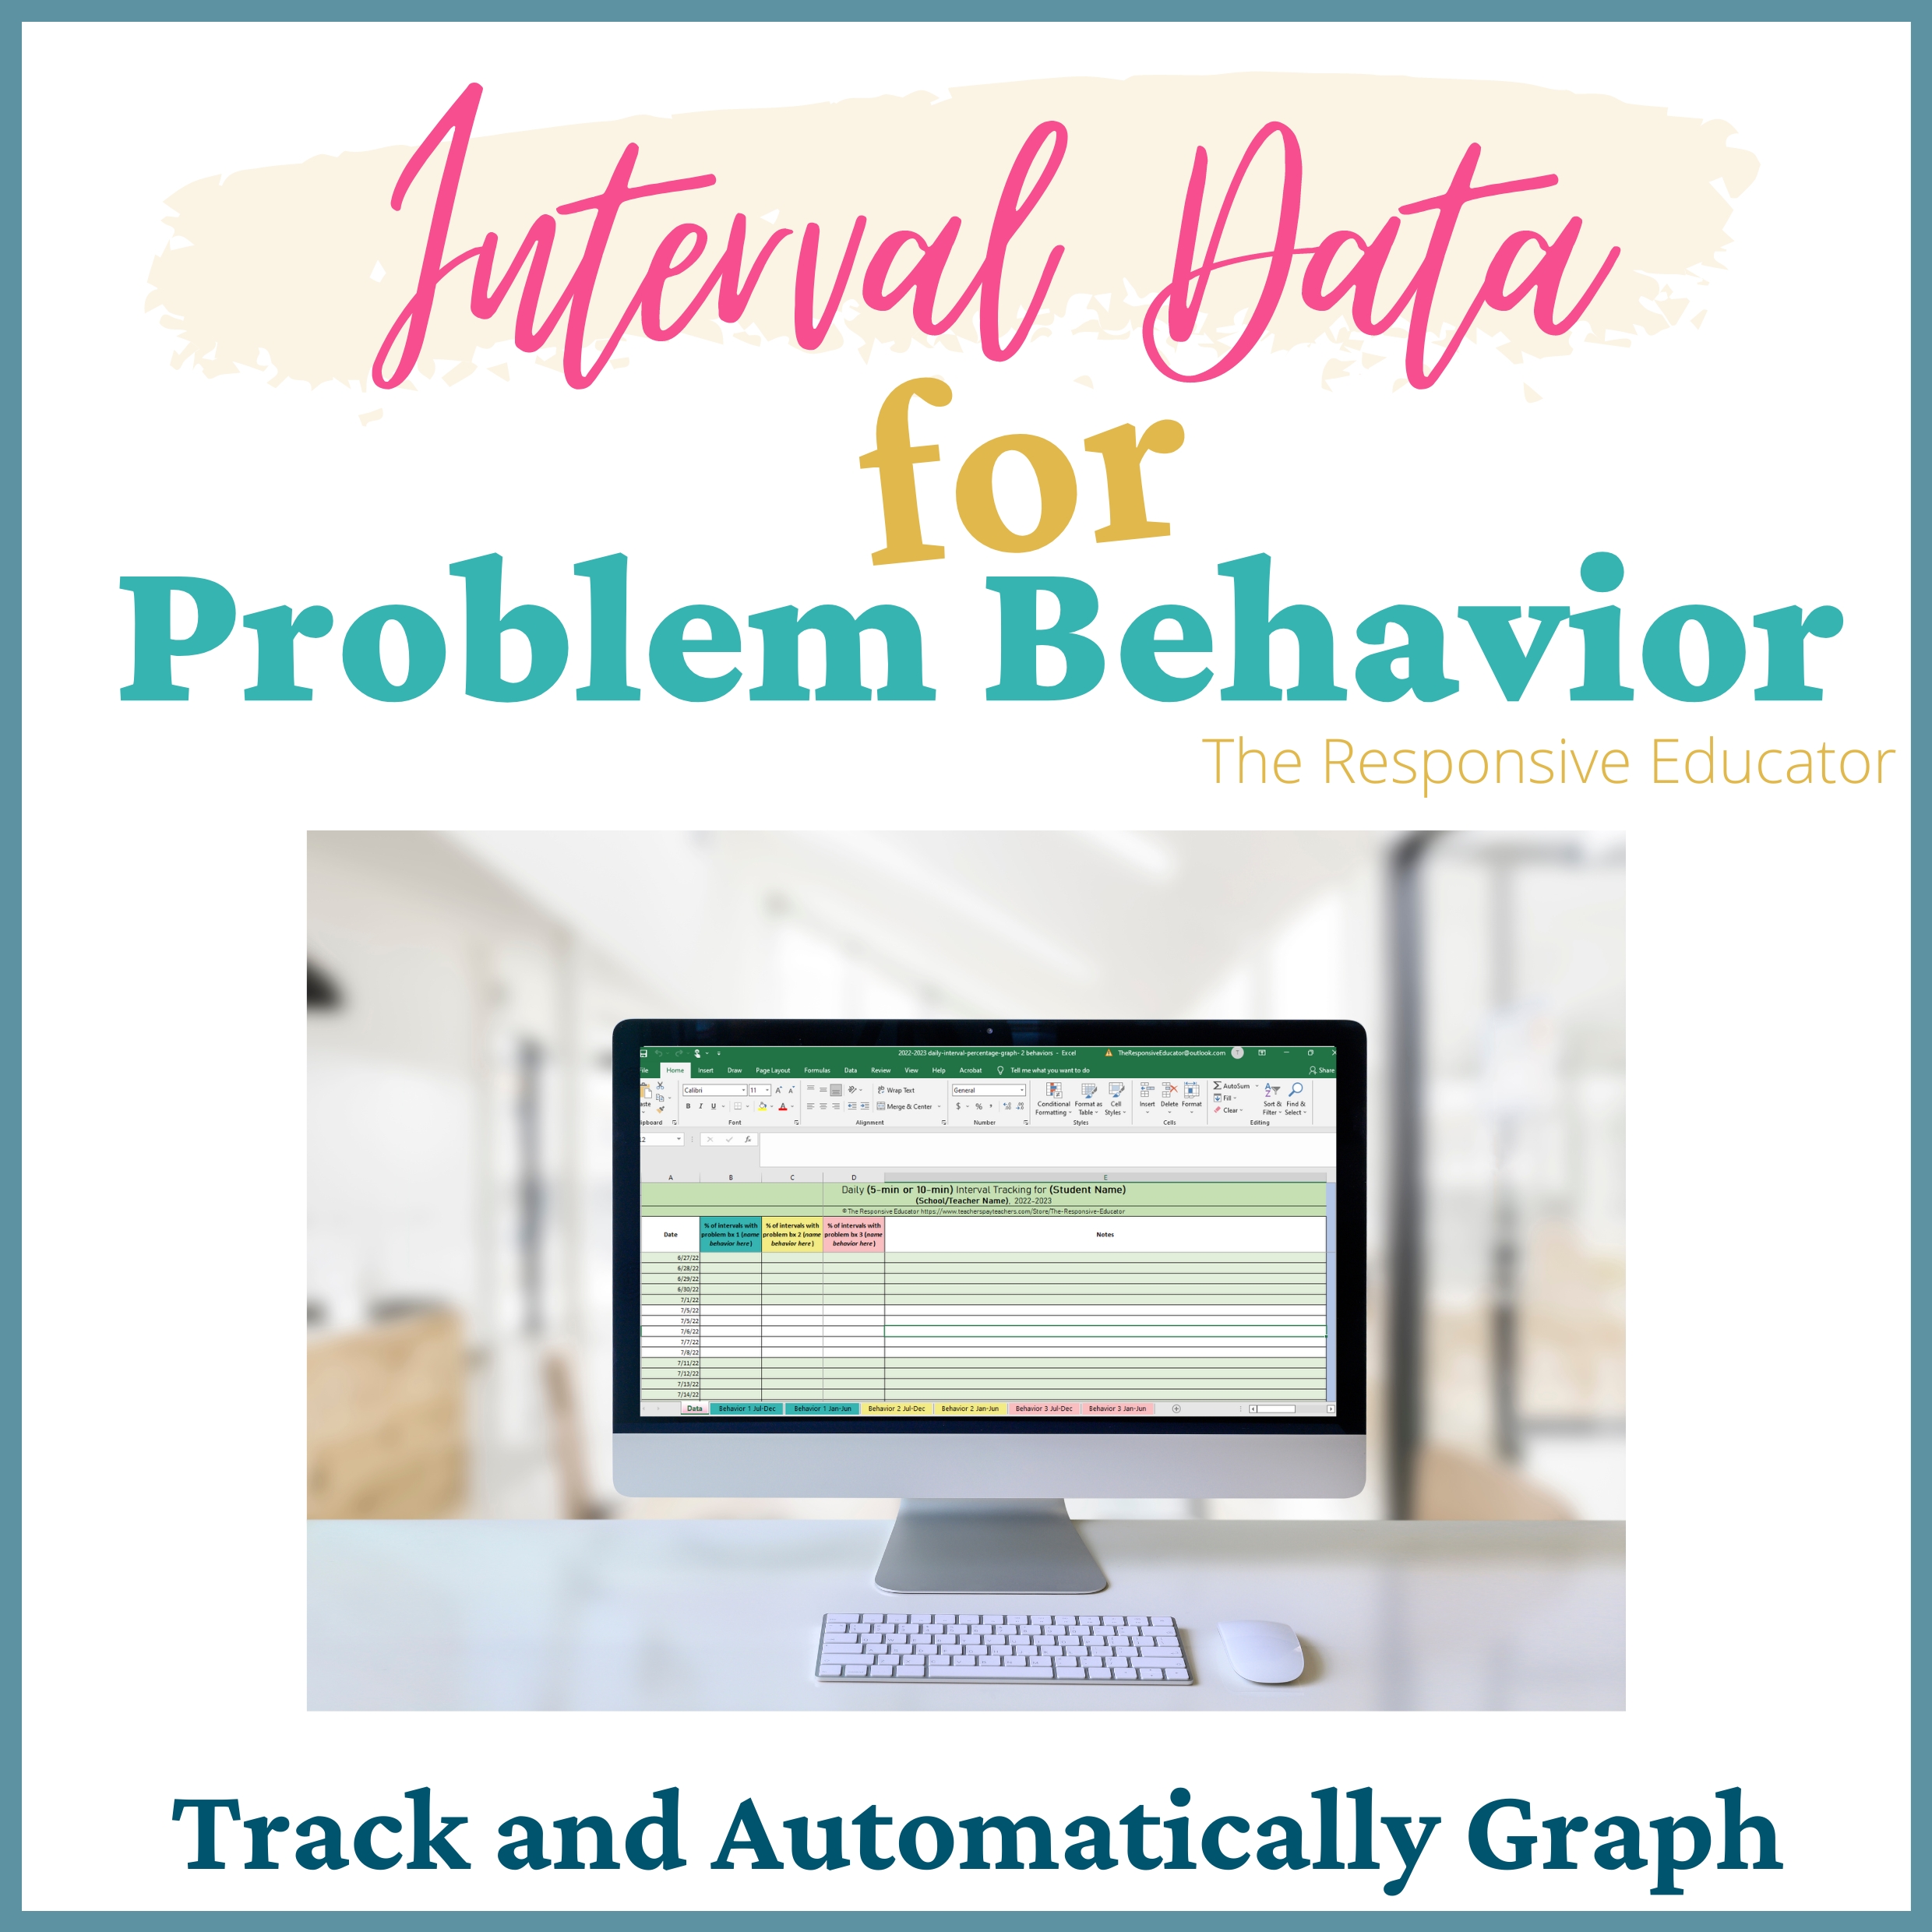
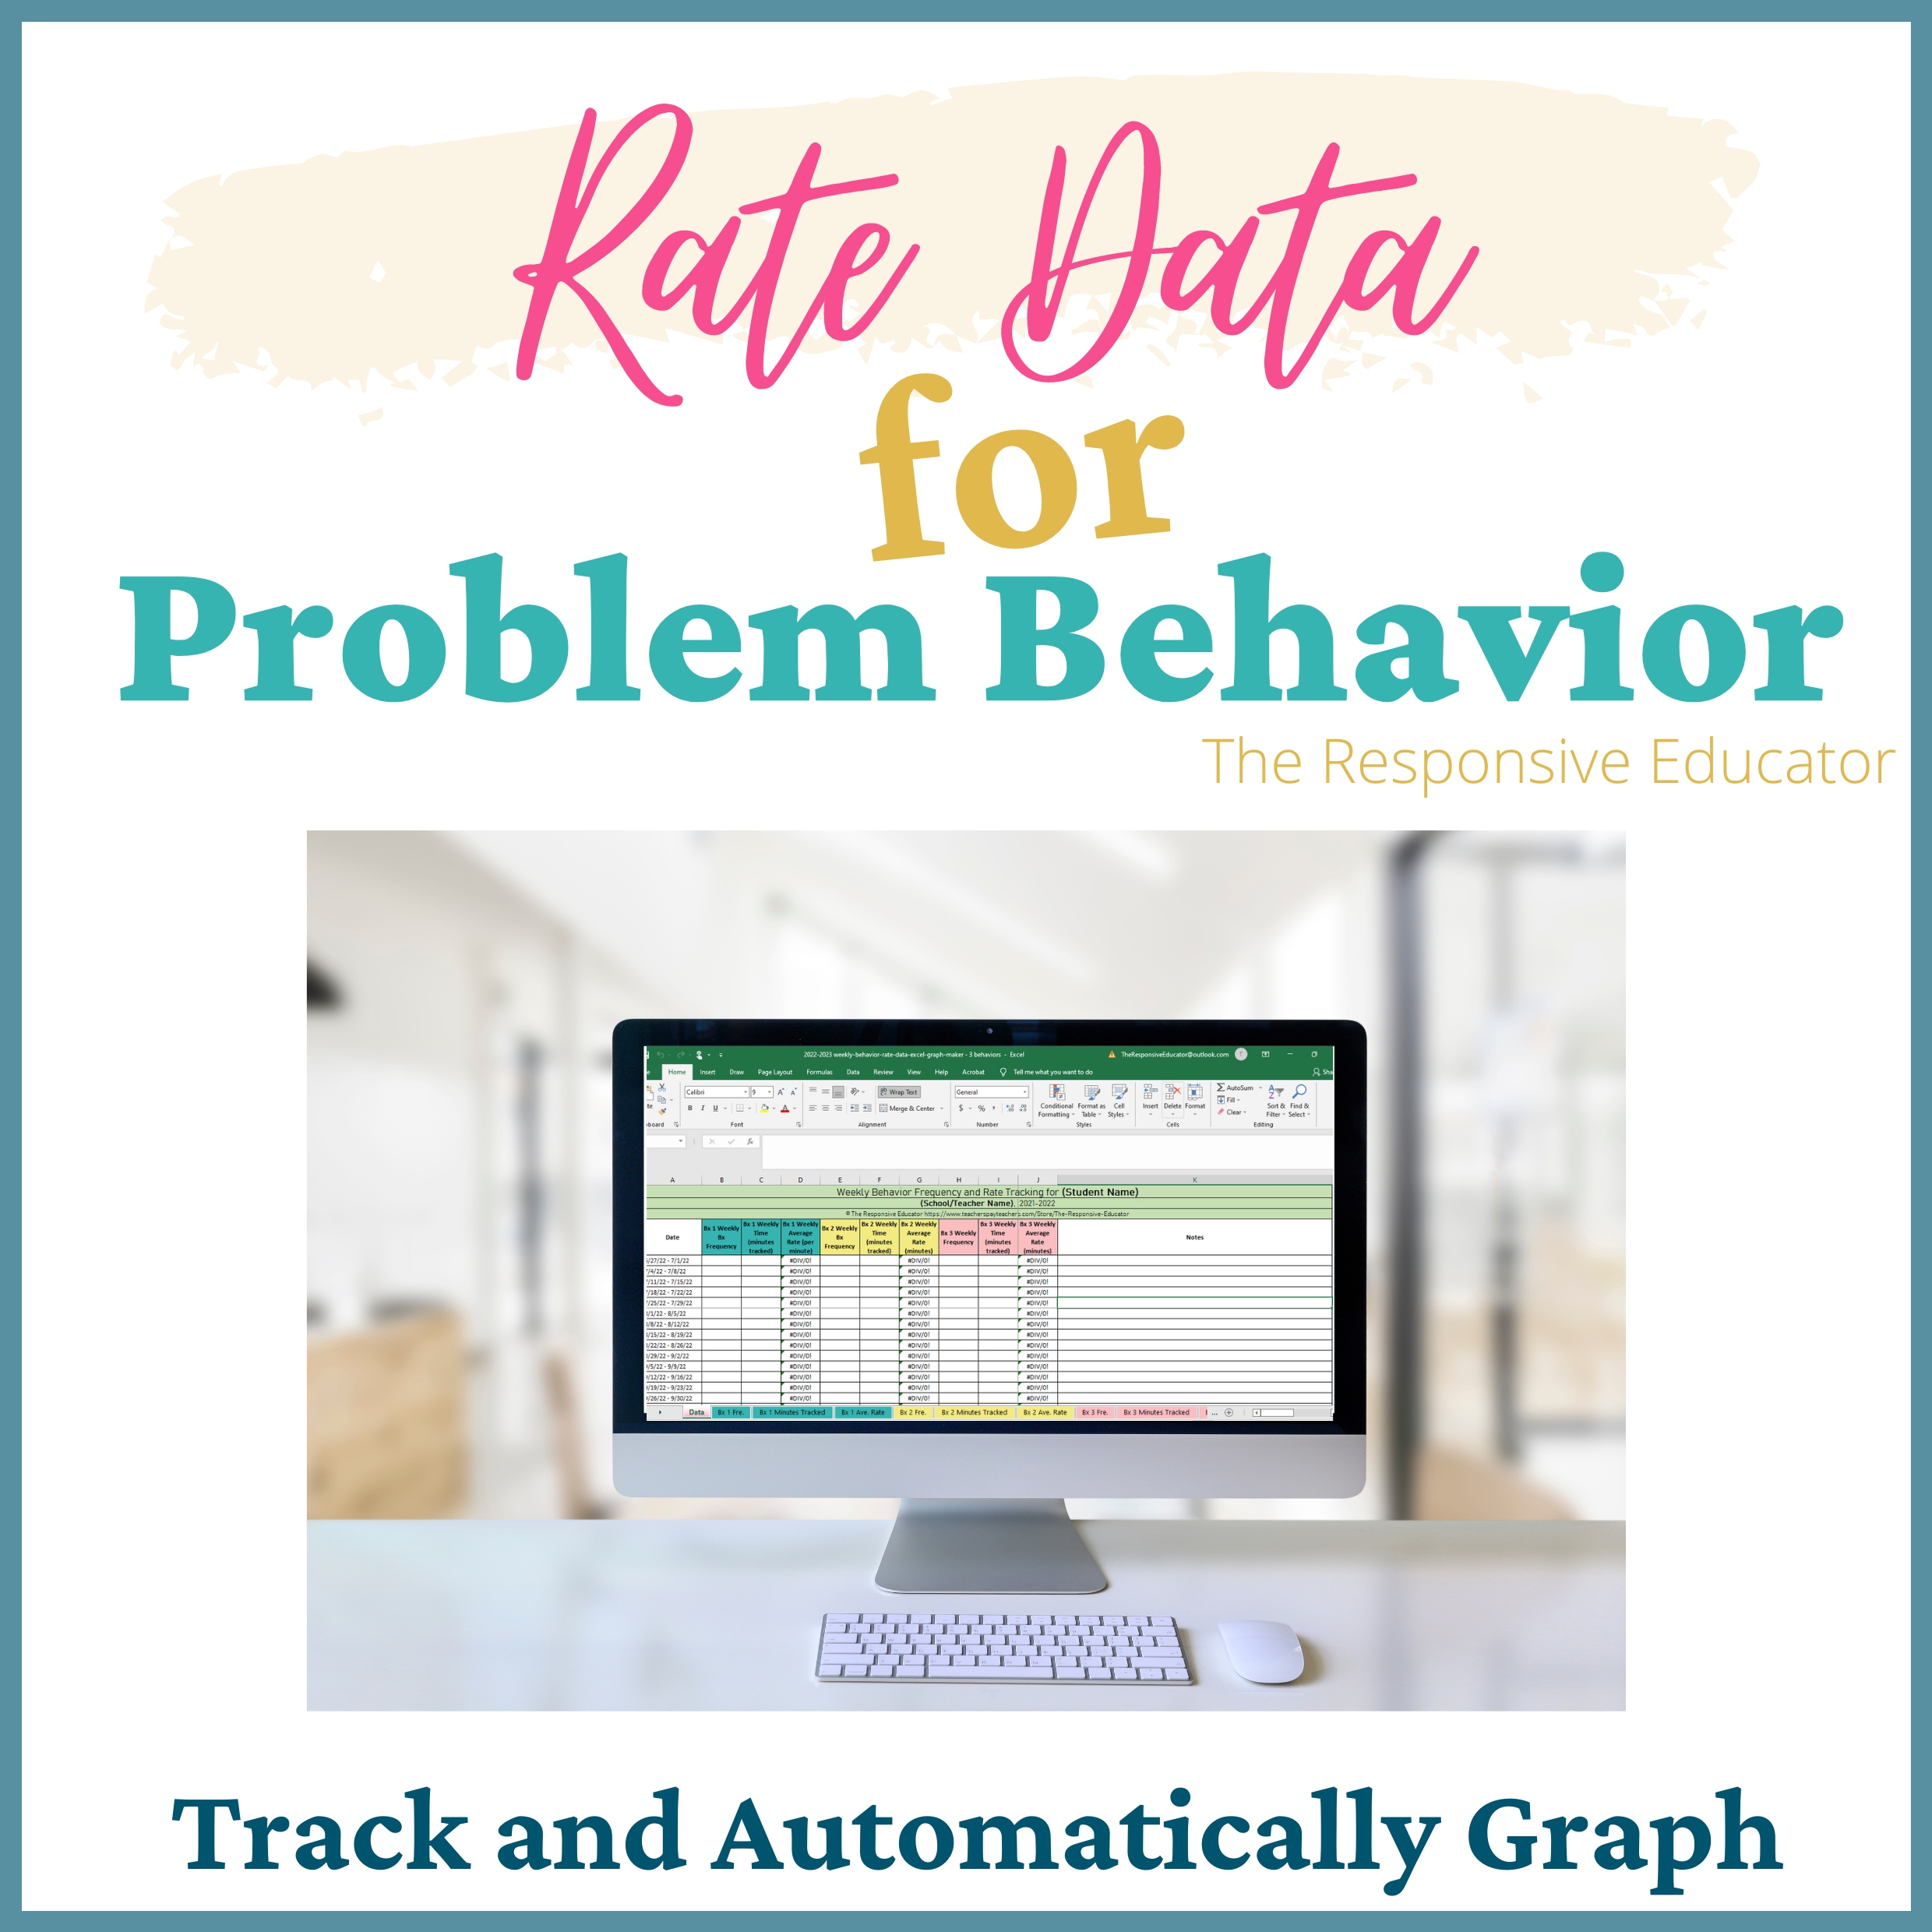
Is Frequency Tracking the Best Option?
-
If a behavior occurs too frequently to count reliably, interval recording may be more appropriate.
-
If the concern is how long a behavior lasts, duration tracking will provide more meaningful data.
File Format & Access
-
Digital download
-
Includes printable PDFs and editable spreadsheet files
-
Files are available immediately after purchase
License Information
This resource is licensed for use by one educator. Redistribution or sharing of files is not permitted.
Bottom Line
If you need a practical, reliable way to count behaviors and visualize progress over time, the Frequency Behavior Data Sheet & Student Data Tracking Graph provide a simple system for collecting and using frequency data—without unnecessary complexity.

Reviews
There are no reviews yet.