As a seasoned educator, you know firsthand that dealing with various behaviors in the classroom is part of the journey. While some students respond well to basic interventions, others may require a more targeted and data-driven approach. That’s where ABC Behavior Charting comes to your rescue, empowering you to make informed decisions and take action!

In this article, we’ll start with a brief review on what Functional Behavior Assessments (FBAs) are and why they matter in education. Note: For a more detailed explanation of Functional Behavior Assessments and ABC data, see my post How to Conduct a Functional Behaviour Assessment: A Comprehensive Guide for Educators.
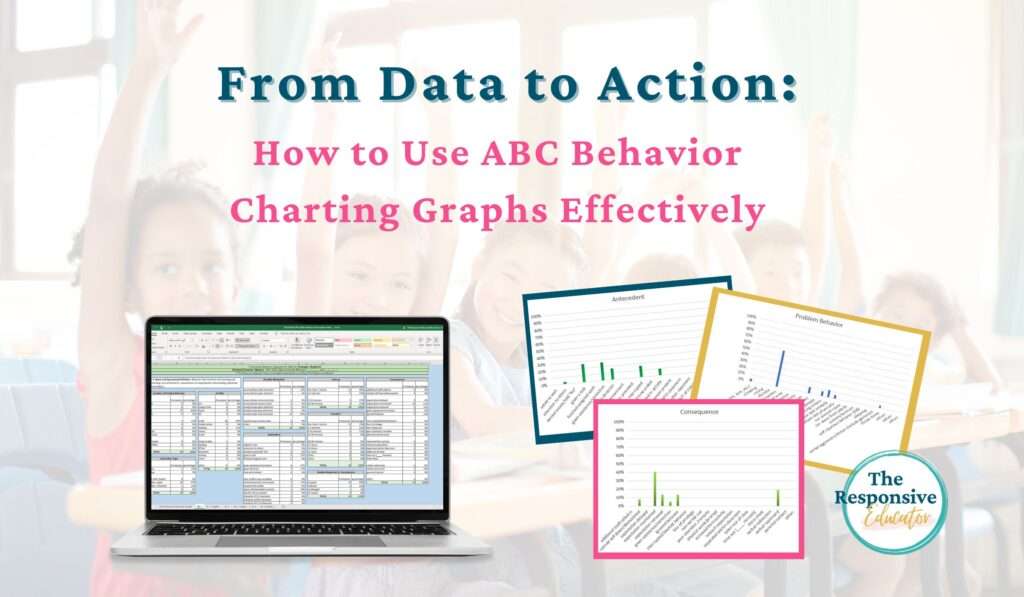
After that brief review, we will discuss the importance of gathering quantitative data on problem behaviors and translating it into visual representations, and I will introduce you to a real game-changer: ABC Behavior Charting. Our product is designed to save busy educators like you precious time by providing you with everything you need to collect and graph detailed antecedent, behavior, and consequence data.
Unlock the ability to determine the function of behavior and make impactful decisions. With our product, you’ll present your insights with polish and professionalism.
Note: I am an Amazon Affiliate. If you purchase products through the links provided, I will earn a small commission at no extra cost to you, which helps support the blog.


ABC data is a structured method for recording and analyzing behavior patterns. It involves three key elements: Antecedent, Behavior, and Consequence.
The Antecedent is the event or situation that occurs before the Behavior, which is the specific behavior being observed. The Consequence is what happens immediately after the behavior occurs.
By analyzing ABC data, educators and professionals gain insights into the relationships between these elements and understand the function of behavior. This understanding guides the development of effective interventions to address challenging behaviors.

With ABC Behavior Charting, educators gain valuable insights and foster a positive learning environment for their students.

Step 1: Begin by collecting behavior documentation. You can use our detailed incident checklist (print or clickable PDF) makes gathering FBA data quick and painless.
Alternatively, feel free to utilize your own preferred documentation form or traditional ABC data sheets, such as office disciplinary referrals.
Step 2: Enter frequency data for all problem behaviors into our user-friendly FBA Excel Graph-Maker. Instantly receive a bar graph highlighting the most significant behavior patterns. From here, pinpoint the 1-3 key behaviors, addressing safety concerns first and then the most significant disruptive behaviors.
Step 3: Seamlessly record ABC data (antecedents and consequences) for each occurrence of your target behaviors in the provided spreadsheets. This in-depth information aids in narrowing down the function of behavior, laying the foundation for crafting effective Behavior Intervention Plans (BIPs).

Analyzing behavior data is essential when conducting a Functional Behavior Assessment (FBA) for students with challenging behaviors in various settings.
With ABC Behavior Charting, effortlessly input data and generate up to ten different types of graphs. Choose the graphs that suit your needs, and enjoy the flexibility of fully editable options to customize them to your preferences.
Graphs provide valuable insights into various aspects of problem behaviors, allowing educators to target interventions more effectively and tailor support to each student’s needs.
Graphs show the frequency of specific behaviors, helping identify which behaviors occur most frequently or are most problematic.
Graphs reveal where the behaviors occur, such as in the classroom, on the playground, or during specific activities. This information helps identify environmental triggers and guides interventions for specific settings.
Graphs demonstrate when the behavior occurs during specific types of instruction, such as whole-group or independent work. This helps identify effective instructional strategies and supports the student’s learning style.

Graphs indicate whether the behavior is associated with certain activities, like reading or math. This information guides interventions to support the student’s engagement and success in those activities.
Graphs show whether the behavior is driven by specific consequences, such as seeking attention or avoiding tasks. This helps identify underlying motivations and informs appropriate interventions.
Graphs display the environmental factors present before the behavior occurs, such as certain tasks or social situations. Identifying triggers guides the development of preventive interventions.
Graphs show the time it takes for the behavior to occur after an antecedent is presented. This information helps understand response speed and efficiency, informing performance-based interventions.

Graphs illustrate how long the behavior lasts once it occurs. This provides insights into behavior intensity and persistence, guiding the development of appropriate interventions.
Graphs reveal what happens after the behavior occurs, such as reinforcement or punishment. This information identifies maintaining consequences and informs interventions that promote positive behavior.
These graphs depict how the student responds to consequences. When confronted with the consequence for their behavior, does your student decrease or stop the behavior? Or does it increase? Understanding effective consequences guides interventions that support the student’s success.
By utilizing this variety of graph types, you will gain a comprehensive understanding of problem behaviors, enabling you to implement targeted interventions that address the root causes and promote positive behavioral outcomes.
ABC Behavior Charting is the ultimate game-changer for educators seeking targeted interventions to address challenging behaviors!
With visually appealing graphs that provide valuable insights into behavior patterns and motivations, educators can make data-driven decisions without the burden of manual graph creation.
Say goodbye to time-consuming tasks and energy-draining efforts in creating graphs from scratch – ABC Behavior Charting does it all for you, saving your precious time and streamlining your Functional Behavior Assessments.
Foster collaboration among educators, professionals, and parents with clear and accessible data presentations, leading to a comprehensive approach to behavior management. Act now and unleash the transformative potential of ABC Behavior Charting!


Support your students’ individual needs with our exclusive Classroom Concerns Checklist.
Identify key concerns in areas like:
…and more to help drive collaboration and problem-solving.
Sign up now to receive instant access and valuable insights on addressing classroom concerns.