Description
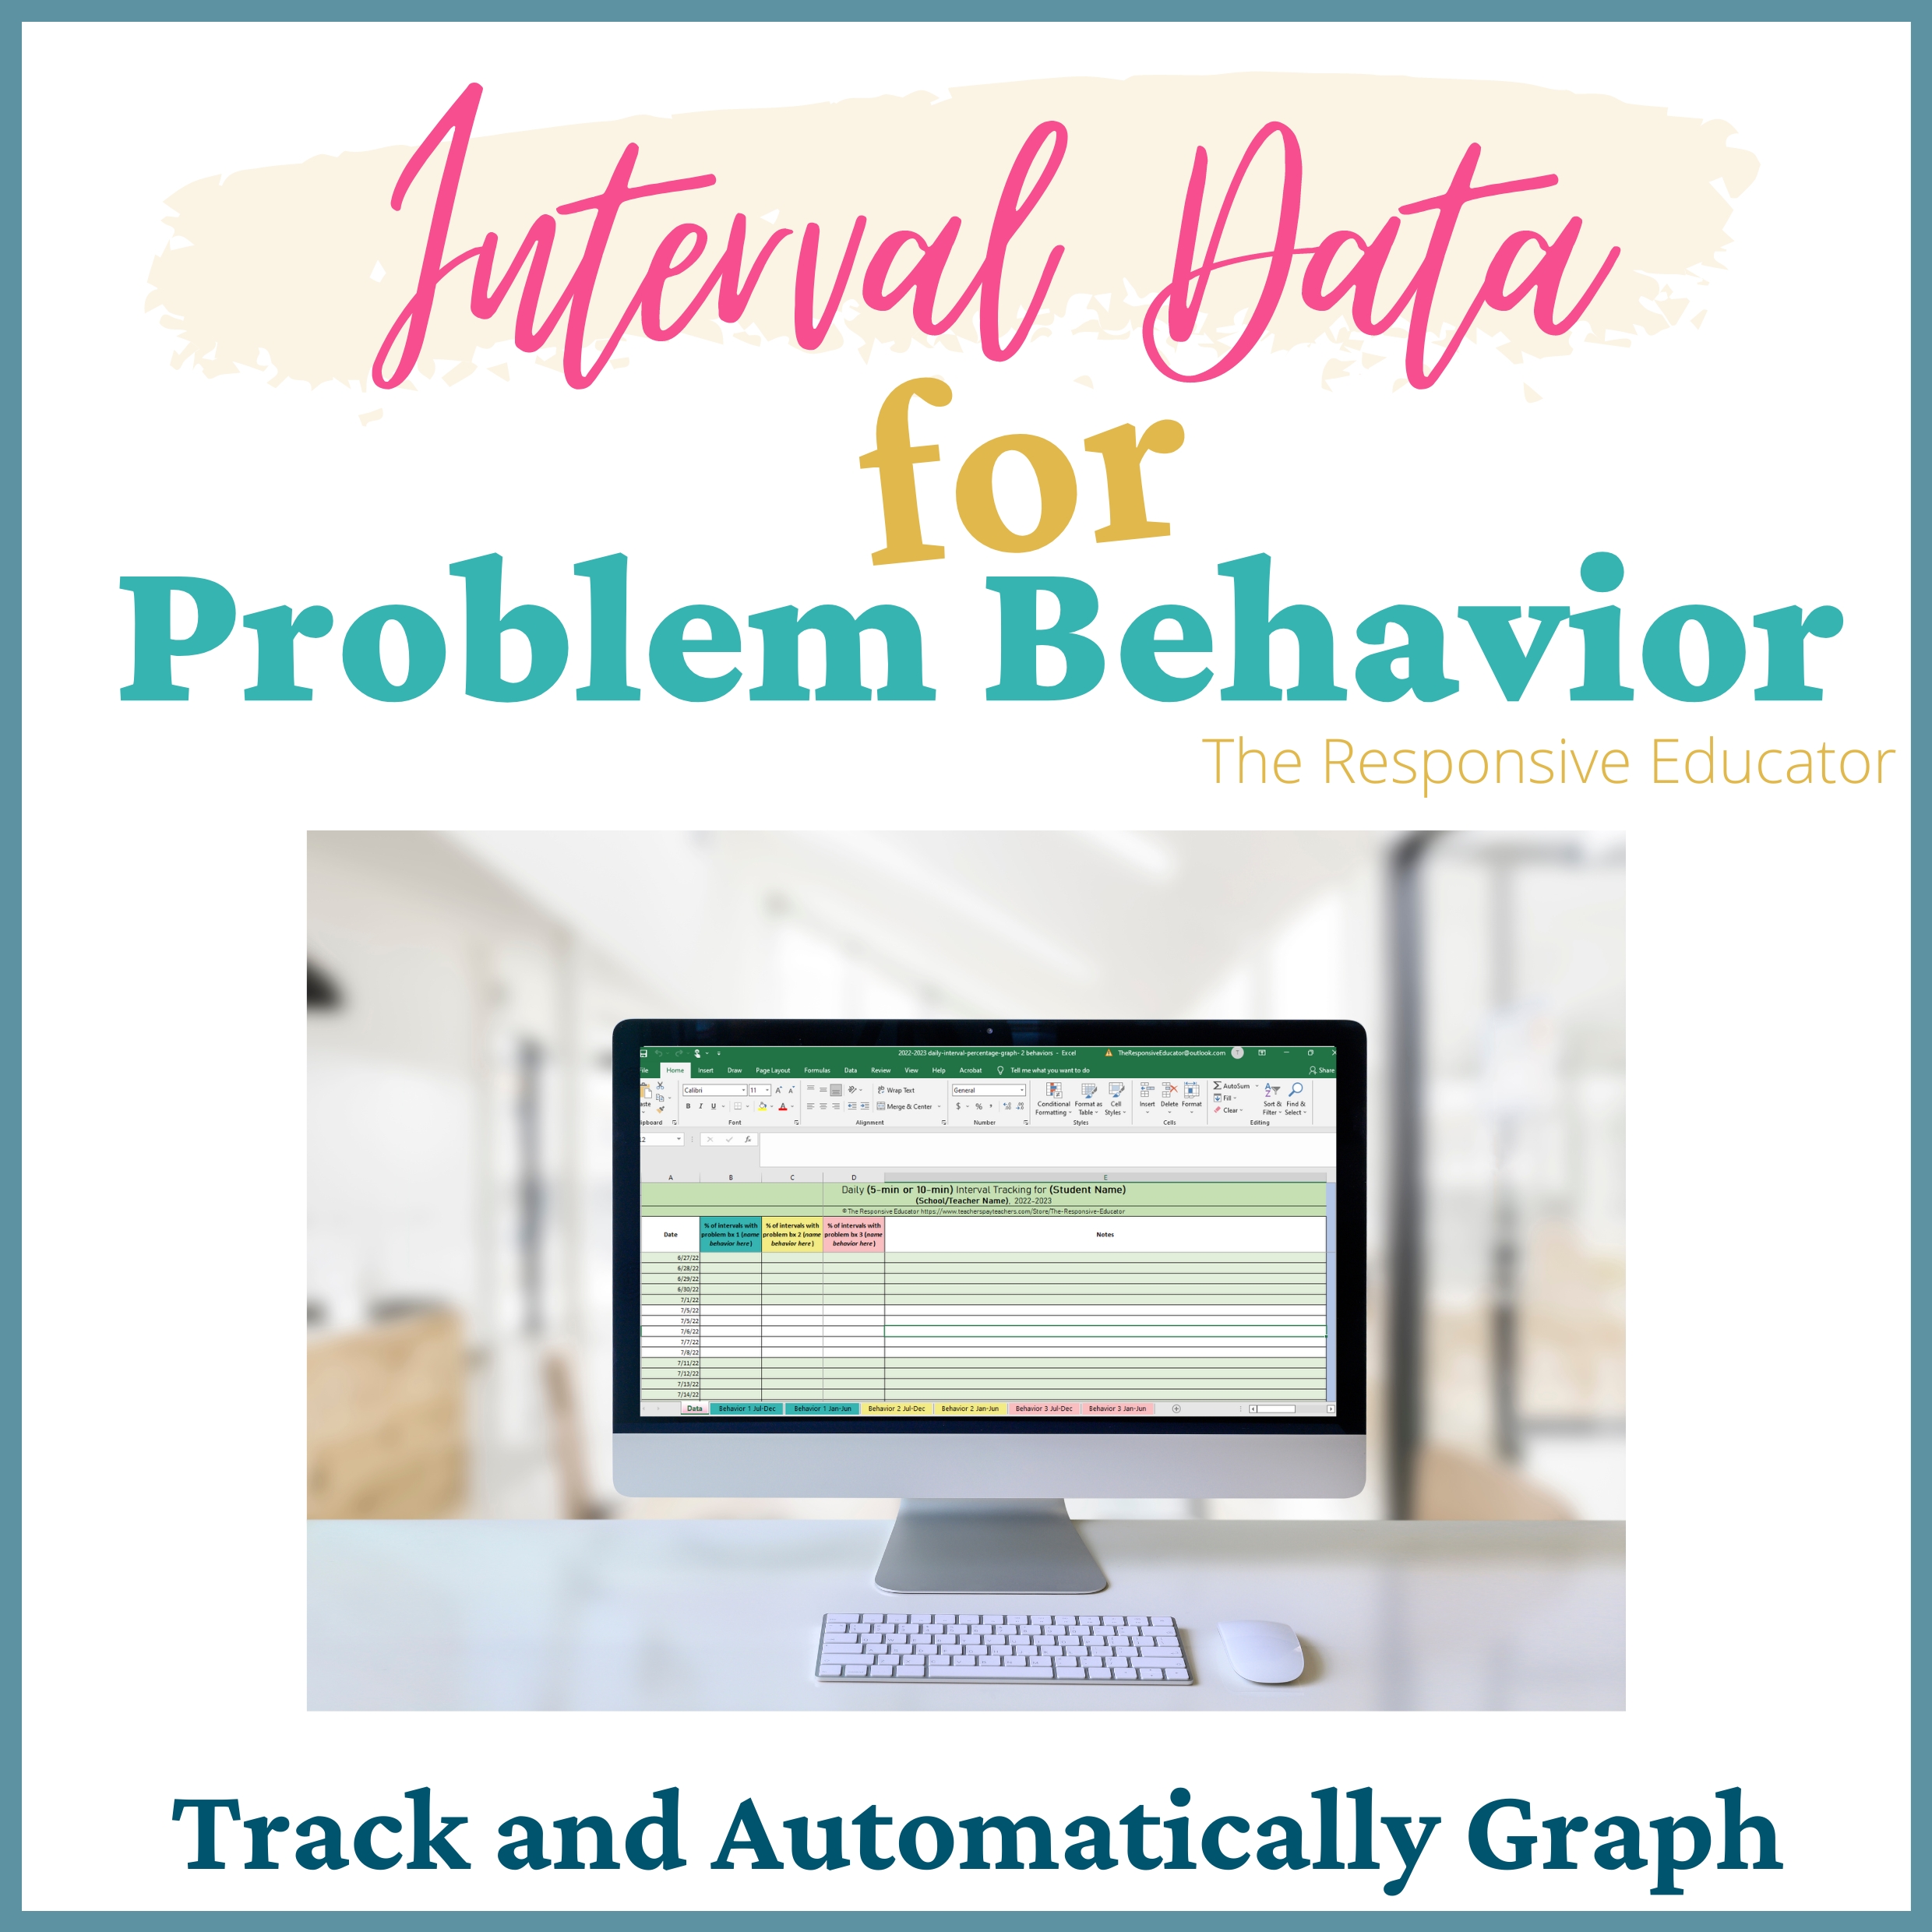
Interval Behavior Data Tracking Sheet & Digital Graphing Tool
Some behaviors occur too frequently to count accurately, making traditional frequency data unreliable. Educators are often left struggling to document behavior patterns while still managing instruction and interventions.
The Interval Behavior Data Tracking Sheet & Digital Graphing Tool provides a structured, efficient way to track high-frequency behaviors using interval recording. This approach allows you to collect meaningful data without counting every instance, helping you identify trends and monitor progress over time.
Instead of overwhelming tallies, interval data offers a clearer picture of behavior patterns you can actually use.
When Interval Data Is the Best Choice
Interval recording works best when:
-
Behaviors happen constantly or repeatedly
-
Frequency data becomes impractical
-
You need an overall pattern rather than exact counts
With interval data, you track whether a behavior occurred during each set time period, creating manageable and reliable data.
What This Tool Helps You Do
-
Monitor high-frequency behaviors consistently
-
Identify trends across activities or times of day
-
Evaluate the impact of interventions
-
Support data-driven behavior planning and progress monitoring
What’s Included
-
Six Interval Recording Forms
For structured observation using 5-minute or 10-minute intervals -
Daily Interval Behavior Graphs
Editable spreadsheets available through the 2029–2030 school year -
Quick Overview of Common Data Collection Methods
Helps confirm when interval recording is the appropriate option -
Quick Excel Tips
Makes data entry faster and more efficient -
Example Behavior Graph
Includes a trend line and phase line -
Phase Line Instructions
Step-by-step guidance included
How to Use the Interval Behavior Data Tool
-
Select a 5-minute or 10-minute interval recording form.
-
Mark whether the behavior occurred during each interval.
-
Calculate the percentage of intervals with observed behavior.
-
Enter data into the spreadsheet to generate graphs automatically.
-
Use trends to guide intervention decisions.
Using Phase Lines for Better Insight
Phase lines help document major changes that may impact behavior, including:
-
Intervention changes
-
Medication adjustments
-
Schedule or environmental changes
Important Note:
This resource works in Excel and Google Sheets, but phase lines can only be added in Excel.
File Format & Access
-
Digital download
-
Printable PDFs and editable spreadsheet files included
-
Files available immediately after purchase
License Information
Licensed for use by one educator. Redistribution or sharing is not permitted.
Bottom Line
If counting behaviors isn’t realistic, the Interval Behavior Data Tracking Sheet offers a practical, reliable way to track high-frequency behaviors and make informed, data-driven decisions—without overcomplicating the process.

Reviews
There are no reviews yet.