
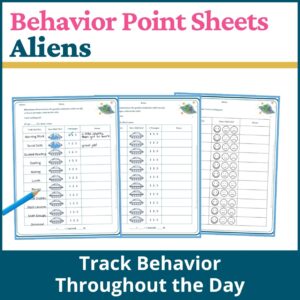


Description
Daily point sheets can provide useful information, but reviewing weeks of scores takes time when the numbers are scattered across paper forms. This Daily Behavior Chart with Automatic Graphing connects daily goal recording with Excel progress graphs. Record performance on the point sheet, enter goal percentages in the workbook, and review the resulting graphs when discussing student progress and support needs. See Preview
Record Up to Five Goals During the School Day
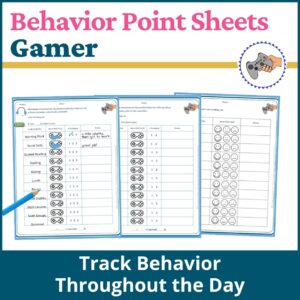
Use the prewritten point sheet or enter individualized goals in the type-in template. The prewritten version addresses accepting directions or corrections, remaining on-task, cooperating, participating, and language. Add class periods, times, or activities to organize scoring across the student’s day.
The scoring scale assigns 2 points for 0–1 prompt, 1 point for 2–3 prompts, and 0 points for 4 or more prompts. Review what counts as a prompt and define each target skill with the staff using the chart. A shared scoring rule can improve consistency, but staff still need to use it in the same way.
Turn Goal Percentages into Progress Graphs
Calculate the percentage of points earned for each goal, then enter those percentages on the spreadsheet’s Data tab. The workbooks include graphs for five individual goals and an overall score. Formulas calculate the overall score as the average of the entered goal percentages.
The daily workbooks organize individual and overall graphs into July–December and January–June views. Separate weekly workbooks provide a weekly reporting option when that better matches your monitoring routine. Graphs link to the data-entry cells, so you can update the record without building a new chart for each report.
Review Independence and Support Needs
Because the point-sheet scale reflects prompting, use the results to discuss how much adult support the student needed for the selected skills. Compare patterns over time alongside notes about the activity, accommodations, and supports in place. A percentage is more useful when the team understands what was scored and how opportunities were defined.
Use individual goal graphs when reviewing a particular IEP objective rather than relying only on the overall average. The chart does not directly measure the frequency, duration, or function of behavior. Choose a measurement method that matches the student’s goal and use additional observation tools when needed.
Include Students and Families in the Review
The point-sheet PDFs include teacher comments, a parent signature line, and parent comments or questions. Use these spaces to share context and invite communication about what helped the student. Reviewing scores with the student can also support a discussion of successful strategies and the next skill to practice.
Graphs can help teams review patterns and discuss whether supports need adjustment. Use them alongside other relevant information rather than treating one score or trend as sufficient for a service or placement decision.
What’s Included in Daily Behavior Chart with Automatic Graphing: IEP Goal Tracking & Point Sheets
- Two-page point-sheet PDF with five defined behavior goals
- Two-page type-in point-sheet template PDF for individualized goals
- Fillable PDF fields and printable pages
- Teacher and parent comment spaces and a parent signature line
- Daily Excel behavior-goal workbooks for 2025–2026, 2026–2027, 2027–2028, 2028–2029, and 2029–2030
- Weekly Excel behavior-goal workbooks for the same five school years
- Individual graphs for five goals and overall percentage graphs
- Quick Excel Tips document with graphing guidance
- Common Data Collection Methods overview
Formats and Software
The download contains Excel .xlsx workbooks and PDF point sheets. Use a compatible PDF reader for the provided type-in fields; filling fields does not make the page layout fully customizable. Excel is the verified native file format for the graphing workbooks.
The creator describes using the workbooks in Google Sheets, but imported formulas, chart formatting, and annotation workflows should be checked before relying on that version. No native Google Sheets file or live synchronization setup is included in the inspected ZIP. This listing does not promise that all Excel features transfer unchanged.
Choose Point Sheets with Graphing When You Need Trends Over Time
This resource includes the point-sheet recording tools and the Excel graphing workbooks. Choose it when you want to move from daily scores to visual progress monitoring. Standalone point-sheet products focus on recording and reviewing the day and do not necessarily include these graphing files.
Reviews
There are no reviews yet.