Today, we are going to look at the use of rate and rate graphs to assist in monitoring and improving student behavior in educational settings. As educators, we understand the significance of managing behavior to foster a positive and productive learning environment.
While tracking frequency data is a common practice for measuring behavior, incorporating rate data and analyzing data using rate graphs can provide a more precise understanding of behavior occurrence over a specific time period. Additionally, we will explore which behaviors are suitable for rate tracking and which ones may not be as suitable.
By the end of this post, you will have a better understanding of the concept of rate, how to measure it, and how to effectively utilize it. This knowledge will aid you in developing targeted interventions and monitoring progress toward behavior goals.
Note: I am an Amazon Affiliate. If you purchase products through the links provided, I will earn a small commission at no extra cost to you, which helps support the blog.
Tracking student behavior is essential for creating a productive learning environment, but not all behaviors are best measured using interval data. For behaviors that occur continuously or have varying durations, rate may be a more appropriate method for tracking behavior.
Rate involves measuring the frequency of a behavior over a specific time period, such as the number of times a student raises their hand in an hour. This method can be particularly useful for behaviors such as on-task behavior or completing homework, which may occur for varying durations and may not be well-suited for interval counting.
By using rate to track behavior data and create rate graphs, educators can gain valuable insights into the frequency of specific behaviors and make informed decisions about how to address them. For example, if a teacher notices that a student is consistently off-task during class, they may decide to implement a daily check-in to help the student stay on track.
Frequency and rate are both commonly used to track student behavior, but there is a key difference between them. Frequency data measures the number of times a behavior occurs within a given period of time, such as the number of times a student speaks out of turn during a class period.
In contrast, rate data measures the frequency of a behavior in relation to the amount of time that behavior could have occurred, typically expressed as a ratio or percentage. For example, a rate of 50% might indicate that a student was on-task for half of the observation period.
While frequency data can be useful for identifying patterns and trends in behavior, rate data provides a more nuanced picture of behavior by taking into account the amount of time that behavior could have occurred. This can be particularly valuable when tracking behaviors that occur over longer periods of time or when comparing the behavior of multiple students who may have different amounts of time for the behavior to occur.
Clearly define the behavior you want to observe and record. As always, it’s vital to clearly define the behavior you will be tracking to ensure consistency and accuracy in data collection. If you need help operationally defining target behaviors, see this post: How to Use Behavioral Baseline Data to Set Realistic Goals and Measure Success.
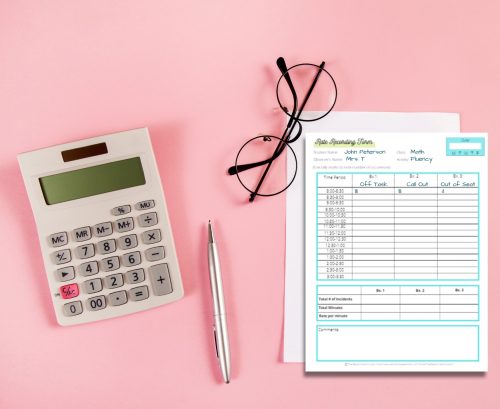
To track the rate of a particular behavior, educators can use a simple tally system. For instance, if a teacher wants to track how many times a student engages in an off-task behavior during a class period, the teacher can use a tally sheet to mark each occurrence of the behavior.
To use a tally sheet, the teacher would create a table with a column for the behavior they want to track and a row for each student. Then, as they observe the behavior, they would make a tally mark in the appropriate cell of the table.
At the end of the class period or designated observation period, the teacher would count up the tally marks to determine the total number of occurrences of the behavior for each student.
The next step is to divide the frequency of the behavior by the total time observed. For example, if you observed a student engaging in a behavior 10 times during a 30-minute observation period, the frequency of the behavior would be 10. To get the rate count, you would divide the frequency (10) by the total time observed (30 minutes) to get a rate count of 0.33 occurrences per minute.

Using the example of the student’s on-task behavior in a 30-minute class, if you observed the student remaining on-task 12 times during the observation period, the frequency of the behavior would be 12. To get the rate count of the behavior, you would divide the frequency (12) by the total time observed (30 minutes) to get a rate count of 0.4 occurrences per minute.
It’s important to note that rate count provides a more accurate representation of the behavior than frequency alone, as it takes into account the amount of time observed. This information can be helpful in identifying patterns and trends in behavior over time, as well as in developing effective interventions to address problematic behaviors.
When determining the rate of student behavior, it is also important to consider the appropriate time frame for observation. Depending on the behavior being observed, it may be helpful to observe the behavior for several days or weeks, divided into smaller time intervals. Remember that you always want to gather baseline behavior data against which to measure student progress so that you can then move into the intervention phase.
For example, if you wanted to track a student’s rate of asking questions during class, you may collect data for multiple 15-minute intervals over the course of a week. This allows for a more accurate assessment of the student’s behavior and can reveal patterns or trends that may not be apparent in shorter observations.

When recording student behavior rates, accuracy is crucial in capturing the behavior of interest. This entails tallying the occurrences of the behavior within a specific timeframe. The collected information is then utilized to determine the frequency of the behavior per hour, minute, or another designated time unit.
To record the data using event recording, simply count the number of times the behavior transpires within the specified timeframe. For instance, if you are monitoring a student’s pencil-tapping behavior during a 30-minute class, count how many times the student taps their pencil during that half-hour period. Subsequently, this data can be employed to calculate the frequency of the behavior per minute.
Maintaining consistency and reliability in the recording method is crucial to ensure that the data accurately represents the student’s behavior. It may also be beneficial to involve multiple observers or employ a combination of different recording methods to gain a more comprehensive understanding of the behavior.
Tools for tracking the rate of behavior range from no-tech tally sheets to technology-based tools like ClassDojo and Classcraft.
Tally sheets are simple and efficient, requiring only a sheet of paper and a pen to count the frequency of a particular behavior during a specified period, while technology-based tools provide whole-class tracking of behaviors, making it easier to identify trends and patterns across multiple students.
Recording by hand doesn’t mean you have no help from technology. There are various technology-based tools available, such as mechanical hand tally counters or electronic finger counters, which are affordable and easy to use.
Using these tools to help you collect and analyze data on the frequency of student behavior can help your team to make informed decisions about classroom management and student support. Identifying patterns in behavior early on can enable teachers to create a positive and productive learning environment for all students.
To gather precise and trustworthy data while using rate count, it is important to adhere to the following tips:
Analyzing the data to identify patterns and trends in the behavior will help you to identify specific times or situations when the behavior occurs more frequently. To analyze rate data on a student’s problem behavior over a two-week period and create targeted interventions, you can follow these steps:
By following these steps, you can analyze the rate data and develop targeted interventions to address the student’s problem behavior effectively. Remember to involve relevant professionals, such as teachers, school psychologists, or behavior specialists, to collaborate and provide support throughout the process.
Rate counting is an effective method for tracking behaviors that occur frequently over a period of time. Collecting data and using it to create rate graphs will give you a visual representation of the data that will assist you in determining potential interventions and tracking their effectiveness. Here are a couple of examples of behaviors that would lend themselves to being measured using rate.

While rate data can provide further insights into the frequency of disruptive talking, it may not capture the specific qualities or impact of the behavior. Assessments that consider the disruptive nature, volume, or impact on classroom dynamics, such as teacher observations or behavior checklists, would be more suitable for evaluating and addressing this behavior.

Gather Rate Data: Record the number of requests for assistance per class period or designated timeframe to establish a baseline rate.
Create Rate Graphs: Represent the rate data on a graph, with the x-axis indicating the time and the y-axis displaying the frequency of requests for assistance. The rate graphs visually display variations in the behavior’s occurrence.
Analyze Dependency Patterns: Examine the rate graphs to identify patterns in the student’s reliance on assistance. Look for trends such as particular subjects, tasks, or situations where excessive requests for help occur.
Track Intervention Progress: Continuously track the rate of requests for assistance and update the rate graph. Monitor if the student’s self-reliance improves or if there are fluctuations in the frequency of requests. Modify interventions as necessary to support the student in becoming more independent.
Develop Self-Reliance Strategies: Based on the data analysis, design interventions that promote self-reliance and problem-solving skills. Implement strategies such as providing explicit instructions, gradually fading prompts, teaching self-monitoring techniques, or implementing a peer support system to encourage independence.
By utilizing rate data and rate graphs, teachers can gain valuable insights into the frequency and patterns of problem behaviors. These visual representations inform the development of targeted interventions that address specific behavior concerns and foster positive change in the classroom environment.
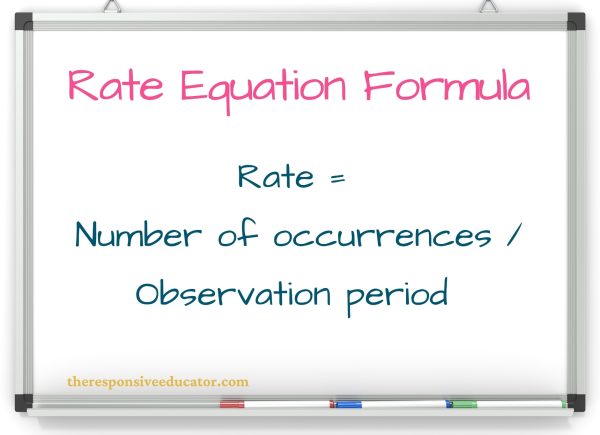
To graph rate of change in Excel, you need to use formulas to calculate the rate for each observation period. The formula for calculating rate is:
Rate = (Number of occurrences) / (Observation period)

By using formulas to calculate the rate for each observation period and graphing the rate data in Excel, you can more easily identify patterns and trends in the frequency of student behavior over time. This information can help educators make data-driven decisions to support student learning and success.
In an elementary school classroom, there are several behaviors where rate might not be the most appropriate means of measurement. Here are some examples:
Measuring the rate at which students complete assignments may not provide a comprehensive understanding of their academic progress or the quality of their work. Instead, other assessment methods, such as evaluating the accuracy, depth, or understanding of the completed assignments, would be more suitable.
Measuring the rate of social interactions, such as sharing or taking turns, may not fully capture the quality and effectiveness of students’ social skills. Assessments that consider the appropriateness, reciprocity, and positive outcomes of interactions, such as structured observations or social skills checklists, would provide a more comprehensive evaluation.
While rate data can track the frequency of non-compliant or defiant behaviors, it may not capture the reasons, triggers, or potential underlying factors driving the behavior. Assessments that delve into the motivations, environmental factors, or individual needs contributing to noncompliance or defiance, such as functional behavior assessments or behavior rating scales, would provide a more comprehensive understanding for intervention planning.
In general, behaviors that involve complex processes, quality of performance, or cognitive abilities often require assessment methods beyond rate measurement. Utilizing a variety of assessment tools and strategies ensures a more comprehensive and accurate evaluation of students’ progress and abilities in these areas.
If you would like an overview of the most common types of behavior data collection used in schools, take a look at my FREE resource, Data Collection for Behavior.
The application of rate counting and rate graphs can prove to be a potent technique for educators to monitor and enhance student behavior within the school premises. The advantages of this methodology are apparent as it furnishes unbiased, numerical data that can aid educators in recognizing challenging behavior patterns, monitoring advancement, and devising specific interventions.
Following the comprehensive instructions detailed in this article, you can seamlessly integrate rate counting into your data collection and formulate customized interventions to tackle distinct behavior issues. By persistently adopting this approach and utilizing data-based strategies, educators can establish a conducive and efficient learning atmosphere for all students.
Do you find it challenging to create accurate and informative rate graphs in Excel for your students’ behavior data? Say goodbye to the hassle and hello to Rate in Excel, the ready-to-use solution that simplifies behavior data collection and progress monitoring.
With Rate in Excel, you can effortlessly input data and generate customizable rate graphs that help you track progress toward IEP goals and identify behavior patterns. No more wasting time creating Excel graphs from scratch, as Rate in Excel streamlines the process for you.
This user-friendly product comes with detailed instructions to help you get started, and it’s fully customizable to fit your specific needs. With Rate in Excel, you can focus on what really matters – your students’ progress and success.
Stop struggling with creating rate graphs in Excel and start using Rate in Excel today. Experience the difference it can make in your behavior data collection and progress monitoring. Click here to find it now!