Behavior tracking and measurement are essential components of effective classroom management. By monitoring student behavior, teachers can identify patterns, track progress, and make informed decisions about interventions and support.
One of the most common methods for behavior measurement is frequency count, which involves counting the number of times a behavior occurs within a specific time frame. This approach is simple and straightforward and can be used to track a wide range of behaviors, from positive behaviors like active engagement to negative behaviors like disruptions.

In this blog post, I will explore the benefits of using frequency count to track and measure student behaviors, as well as situations where frequency count may not be the most appropriate method. I will also provide guidance on how to set up an Excel chart to graph the frequency of student behavior, making it easy to analyze and interpret data.
Whether you are a new teacher looking for strategies to manage your classroom or an experienced educator looking to fine-tune your approach, this post will provide you with valuable insights and practical tips for using frequency count to improve student outcomes.
Note: I am an Amazon Affiliate. If you purchase products through the links provided, I will earn a small commission at no extra cost to you, which helps support the blog.
Frequency count is a useful method for measuring behavior in situations where the behavior is easily observable and measurable. For example, behaviors like completing assignments, raising one’s hand to ask a question, or engaging in off-task behavior can all be easily counted and tracked using frequency count. Tracking the frequency of behaviors can be effective when collecting behavioral baseline data and for use in functional behavior assessments, as well as for progress monitoring behavior intervention plans.
As always, it’s vital to clearly define the behavior you will be tracking to ensure consistency and accuracy in data collection. If you need help operationally defining target behaviors, see this post: How to Use Behavioral Baseline Data to Set Realistic Goals and Measure Success.
One of the key advantages of using frequency count is its simplicity and ease of use. With this method, teachers can quickly and easily gather data on student behavior, even in busy or complex classroom environments. This makes it an ideal approach for teachers who are looking for a straightforward way to track behavior and make data-driven decisions.
There are many examples of how frequency count can be used in the classroom. For instance, teachers can use this approach to track positive behaviors like active engagement or participation in class discussions, as well as negative behaviors like talking out of turn or disruptions.

By collecting and analyzing data on these behaviors, teachers can identify patterns and make informed decisions about how to support students and improve outcomes. Additionally, frequency count can be used to evaluate the effectiveness of interventions or support strategies, allowing teachers to adjust their approach as needed.
Remember, frequency count is appropriate for behaviors that are easy to observe, have a clear beginning and end, and are discrete and countable. Some behaviors that could be measured using a frequency count include:
Raising Hand
Raising hand is a behavior commonly expected in classroom settings. Frequency count can be used to track the number of times a student raises their hand to answer a question or ask for help. This information can help educators ensure that all students are participating equally and receiving appropriate support.

Out-of-Seat
Out-of-seat behavior occurs when a student leaves their assigned area without permission. If a student is out of their seat for extended periods of time, duration might be the best way to track the behavior. However, if they frequently leave their seat for brief periods of time, educators can take a frequency count by counting the number of times a student gets out of their seat without permission. This can allow educators to identify patterns or triggers that may be causing the behavior and develop strategies to promote positive behavior.
Turning in Homework
Turning in homework is another behavior that can be effectively tracked using frequency count. By counting the number of times a student turns in their homework on time, educators can determine if the student needs additional support or intervention to meet academic expectations.
Banging Fist or Throwing Items
Banging a fist on a desk and throwing items in class are disruptive behaviors that can be measured using frequency count. By tracking the number of times these behaviors occur, educators can develop interventions to promote positive behavior and a safe learning environment.
Task Initiation
Task initiation within 30 seconds of direction is a behavior that can be measured using frequency count to determine if a student is able to initiate a task in a timely manner. This information can help educators identify if a student needs additional support or intervention to meet academic expectations.

Frequency count can also be a valuable tool for teaching students to self-monitor their own behavior. By introducing frequency count to students, they can develop a better understanding of their actions and take ownership of their behavior in the classroom. One of the greatest benefits I have found in this practice is the increased ability of students to reflect on their behavior.

I vividly remember working with a student who had a habit of constantly calling out in class. This behavior disrupted the teaching and learning environment for everyone. However, I noticed that it wasn’t out of malice, but rather the result of him impulsively sharing every thought that popped into his head. Determined to help him gain awareness of his behavior, I engaged him in a simple frequency count exercise.
I asked him how often he thought he called out in an hour, and he estimated around 6 times. To provide a concrete measurement, I placed a piece of paper on his desk and explained our plan. Whenever he called out, I would discreetly point to his desk, and he would make a mark. At the end of the hour, we would count the marks together.

With good-natured cooperation, he agreed to give it a try. As we began, he quickly realized that he had surpassed his estimated count within the first couple of minutes. Throughout the hour, I observed a visible shift in his behavior as he became more conscious of his impulse to call out. He actively self-monitored and made efforts to restrain himself from interrupting. Surprisingly, we never had to resort to any consequences; all he needed was a gentle reminder to draw his attention to his own behavior.
This experience taught me the power of self-reflection and self-monitoring. By providing students with a tangible method like frequency count, we enable them to recognize their own behaviors and take steps towards self-regulation. It’s amazing how a simple tracking exercise can empower students to make positive changes and contribute to a more productive and harmonious classroom environment.
Frequency is a measure of how often an event occurs in a given period of time. In general, frequency is calculated by dividing the number of occurrences of an event by the length of time over which those occurrences were counted. The resulting number represents the average number of times the event occurred per unit of time.
For example, if you counted the number of times a person blinks their eyes in a minute and found that they blinked 20 times, the frequency of blinking would be 20 divided by 1 minute In other words, the person blinked their eyes 20 times per minute on average.

Implementing frequency count involves several steps to ensure accurate and reliable data collection. Here are some of the key points to decide on:
Before starting the observation period, it’s important to clearly define the behavior you will be tracking. This will ensure consistency and accuracy in data collection.
Decide how long you will be tracking the behavior. It’s best to choose a time frame that is long enough to capture a representative sample of the behavior, but not so long that it becomes difficult to track consistently.
For example, an educator may want to track the frequency of a student’s talking out of turn during a 30-minute class period. If the student talks out of turn 3 times during that period, the educator would record the frequency of the behavior as 3. It is important to ensure that the data collected is accurate and reliable, which may require observing the behavior over multiple class periods or days.
Frequency count data can be useful for identifying patterns and trends in behavior, as well as for setting goals and tracking progress towards behavior goals over time. It is important to consider the advantages and disadvantages of each type of data collection method to ensure that the data collected is appropriate for the behavior being observed and the goals of the observation.

During the observation period, use a tally sheet or other data collection tool to record each instance of the behavior you are tracking. For example, you might use tally marks to record each time a student raises their hand, or each time they engage in off-task behavior.
Tracking and analyzing student behavior is a crucial aspect of effective classroom management. While observation and manual tracking methods can be effective, they can also be time-consuming and prone to errors. Fortunately, there are several tools available to help teachers track the frequency of behaviors in the classroom.
One tool that can be used to track behavior is the Tally Sheet. Tally sheets are simple and efficient, requiring only a sheet of paper and a pen. Teachers can use tally sheets to count the frequency of a particular behavior during a specified period, such as a class period or a day. Tally sheets can be customized to track multiple behaviors or multiple students, making them a versatile tool for classroom management.

For teachers who prefer tools to pencil and paper, there are inexpensive options that can assist you in counting behaviors without missing a step in your teaching.
One simple tool is the mechanical hand tally counter, such as this one. This tool allows teachers to easily count the number of times a behavior occurs during a specific period.
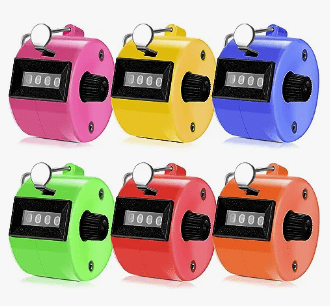
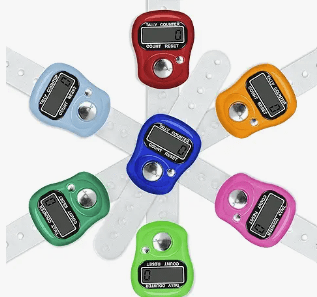
Another similar tool is the electronic finger counter, such as the one found here. This tool can be worn on the teacher’s finger, making it easy to use while walking around the classroom. Both of these tools are affordable and easy to use.
If you are looking for technological tools that work on the whole-class level, there are a few options for that as well. Class Dojo is a popular (and FREE) behavior-tracking app that allows teachers to create a customizable behavior-tracking system.
In Class Dojo, teachers can set up specific behaviors to track, assign points for both positive and problem behaviors, and communicate with parents about student progress. Teachers wanting to track the frequency of specific problem behaviors but not wanting to take points away for them can set the point value for these behaviors at 0, allowing the behavior to be tracked but not penalizing students by removing points.

Classcraft is another app that gamifies classroom behavior tracking, allowing students to earn points and level up by demonstrating positive behaviors. Classcraft has both a FREE and a premium version. As with Class Dojo, analytics can be downloaded, allowing you to track the frequency of specific student behaviors.
Overall, there are many tools and apps available to help teachers track the frequency of behaviors in the classroom. By using these tools, teachers can gain valuable insights into student behavior, identify areas that need improvement, and make data-driven decisions to promote positive behavior in the classroom.

To ensure accurate and reliable data collection when using frequency count, here are some tips to keep in mind:

By following these steps and tips, teachers can use frequency count to gather valuable data on student behavior, which can be used to make data-driven decisions and support positive outcomes in the classroom.

Graphing frequency on Excel involves calculating the frequency of each behavior and then creating a graph to visualize the data. Here is a step-by-step guide on how to create the formulas and graph frequency count data in Excel:

Graphing frequency count data in Excel can help identify patterns and trends that might not be as apparent when looking at the raw data alone. For example, you might notice that the frequency of a certain behavior increases or decreases over time, or that there are certain times of day when the behavior is more or less likely to occur. This information can be invaluable in making data-driven decisions to support students and improve outcomes in the classroom.

When tracking student behavior, it’s important to mark significant changes on the graph. Vertical phase lines can be added to indicate when important events occur, whether at home or school. These events can include teacher or class changes, personal life events like moving or parental divorce, and starting or stopping medication. It’s also helpful to note lengthy school breaks as they can impact student behavior.
Phase lines or condition lines on the behavior graph are used to visually separate different phases or conditions. They make it easier to compare, identify shifts or transitions, analyze treatment effects, and effectively communicate research findings.
")
A trendline is used on a behavior graph to analyze and identify patterns or trends in the data. It helps in visualizing the overall direction or tendency of the behavior being measured over time or across different variables. It helps smooth out variations, forecast future behavior, and facilitates comparisons.
Additionally, trendlines assist in identifying anomalies or irregularities in the data, ensuring data reliability. However, it’s essential to consider other relevant factors to gain a comprehensive understanding of the behavior being analyzed.
To include a trendline on your graph, click on the graph. Then click on the + that will appear in the upper right-hand side of the graph and click the box for trendline.
Tracking student behavior through frequency count can be a useful tool for educators to gather data and identify patterns in student behavior. By analyzing this data, teachers can develop targeted interventions and strategies to promote positive behavior change and create a supportive and effective learning environment. Here are a few practical examples:
A teacher could use frequency count to track the number of times a student engages in disruptive behavior during a class period. This could include behaviors such as talking out of turn, making loud noises, or disrupting the learning of other students. By analyzing this data, the teacher could identify patterns and triggers that lead to the behavior, and develop strategies to address them. For example, the teacher could provide the student with alternative ways to express themselves, such as writing their thoughts down, or provide them with a designated space to work independently.
Frequency count can also be used to track a student’s absences from class. If a student is frequently absent, the teacher could analyze the data to identify patterns or underlying issues that may be contributing to the behavior. For example, the student may be struggling with the material, or they may have personal issues at home that are impacting their attendance. Based on this data, the teacher could develop strategies to support the student, such as providing additional academic assistance or connecting them with resources to address personal issues.

By using frequency count to track the number of incomplete assignments a student has, a teacher can identify patterns in the behavior. For example, the student may consistently struggle with a particular type of assignment, such as writing an essay or completing a math problem set. The teacher could develop strategies to support the student in completing these assignments, such as providing additional instruction or breaking down the assignment into smaller parts.
While frequency count is a valuable tool for measuring behavior in many situations, there are some situations where it may not be the most appropriate method. For example, if the behavior being observed is complex or difficult to measure, frequency count may not provide an accurate representation of the behavior.

An example of a behavior that may not be a good fit for frequency count is anxiety. Anxiety is a complex emotion that can manifest in many different ways, such as nail-biting, sweating, or fidgeting.
While it may be possible to count the number of times a student engages in each of these behaviors, it may not accurately capture the intensity or duration of their anxiety. In this case, it may be more appropriate to use a rating scale or other subjective measure to capture the student’s overall level of anxiety.
In such cases, alternative methods for measuring behavior may be more appropriate. Some possible alternatives include:
Duration Recording: This involves measuring the length of time that a behavior occurs. This method is useful for behaviors that are continuous, such as talking or fidgeting.
Interval Recording: This involves dividing the observation period into equal time intervals and recording whether the behavior occurred during each interval. This method is useful for behaviors that occur at a low frequency, such as aggression or off-task behavior.
Choosing the most appropriate method for measuring behavior depends on the behavior being observed and the goals of the observation. Teachers and other professionals working with students should carefully consider the behavior they are trying to measure and select the method that will provide the most accurate and useful data.
If you would like an overview of the most common types of behavior data collection used in schools, take a look at my FREE resource, Data Collection for Behavior.

Tracking student behavior using frequency count is a simple and effective method for measuring and monitoring their actions. Counting the number of times a specific behavior occurs during a designated time period allows teachers to gain valuable insights into their students’ behavior and make informed decisions about how to best support them.
Are you tired of spending endless hours creating frequency Excel graphs to track student behavior? Well, get ready to breathe a sigh of relief, because I’m here to help!
Introducing Frequency Data for Problem Behavior – the ultimate hassle-free solution for educators who want to measure student behavior, track IEP behavior goals, and evaluate the effectiveness of interventions.
With this product, you can say goodbye to the technicalities of Excel graph creation and hello to fully customizable graphs that will save you time and energy. This product is incredibly easy to use and comes with detailed instructions to help you get started. You can customize the graph to fit your specific needs.
Stop wasting time creating tedious Excel graphs and start focusing on what really matters – your students’ progress and success. Try Frequency Count in Excel today and experience the difference it can make in your behavior data c
ollection and progress monitoring. Don’t miss out –find it here today!


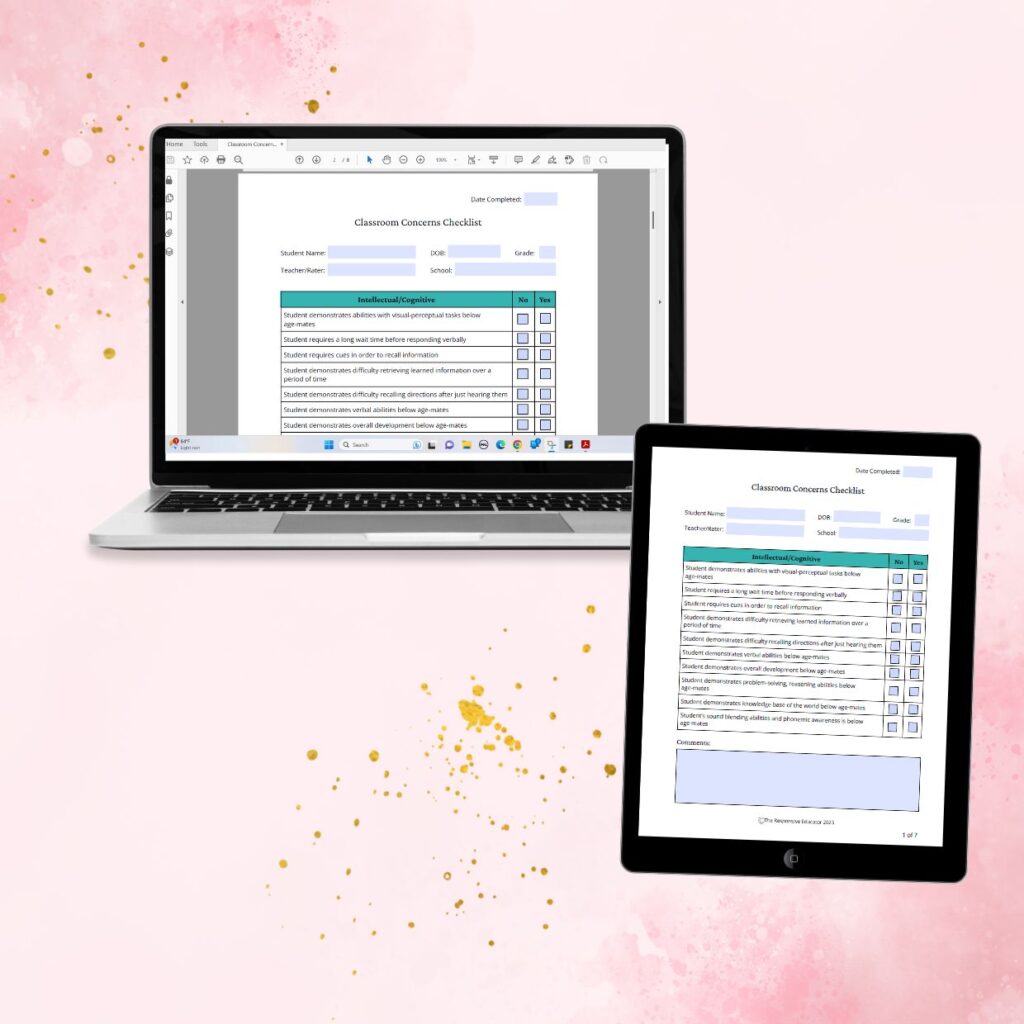
Support your students’ individual needs with our exclusive Classroom Concerns Checklist.
Identify key concerns in areas like:
…and more to help drive collaboration and problem-solving.
Sign up now to receive instant access and valuable insights on addressing classroom concerns.