You can have a folder full of ABC incident reports and still struggle to answer the questions that matter. When reports come from several staff members, cover different parts of the school day, and describe several types of behavior, important patterns can remain buried in rows of information.
That is where ABC behavior charting becomes useful. Graphs can help a team see whether incidents repeatedly occur during certain activities, follow particular antecedents, or result in similar consequences. They also make it easier to communicate what the team has observed without relying on memory or impressions.
However, the graph is only as useful as the information entered into it. Staff members need a consistent way to document incidents, organize the data, and interpret the results without treating a possible pattern as a proven explanation.
My ABC Data Sheet Editable and Digital Graphing System was designed to connect those parts of the process. It includes incident-reporting options, spreadsheets for organizing target behavior data, and automatically generated graphs. If you already own the resource, you can use this tutorial to work through the system step by step. If you are considering it, this walkthrough will show you how the different components work together.
If you need more instruction about what to look for when comparing several ABC reports, How to Use an Antecedent Behavior Consequence Chart to Identify Behavior Patterns explains the professional reasoning behind the analysis. This article focuses specifically on using the forms and graphing system.
This resource is more than a blank antecedent behavior consequence chart. It provides a connected process for moving from individual incident reports to organized ABC behavior graphs.
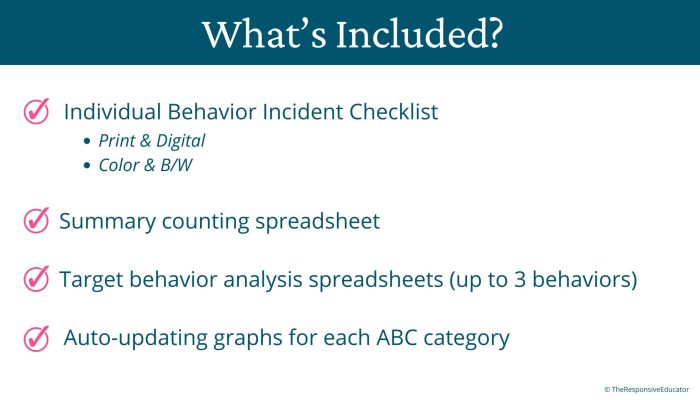
Staff members begin with a printable or clickable incident checklist. The checklist captures the setting, activity, instruction type, antecedent, observable behavior, consequence, duration, latency, student response, and other relevant information. Color and black-and-white versions are included so schools can select the format that works best for their setting.
The information from those reports is then entered into the editable spreadsheet. The first section helps the team review the behaviors that have been documented and prioritize two or three target behaviors for closer analysis. Each selected behavior then receives its own data sheet and set of automatically generated graphs.
This connection is important. A form records what happened during one incident, while a graph helps the team examine what may be happening across multiple incidents.
Graphing does not correct weak data. If one staff member uses “refusal” to mean that a student did not begin within ten seconds while another uses it only when the student verbally said no, their reports are not measuring the same behavior. The graph may look polished, but the information will still be difficult to interpret.
Before collecting data, make sure staff members understand the behavior definitions and the purpose of each category on the form. They should record observable actions rather than conclusions about the student’s attitude or intentions. Notes such as “wanted attention,” “was being defiant,” or “did not care” may reflect the observer’s interpretation rather than something that could be directly seen or heard.
The incident form includes a place to record a possible motivation because an observer’s initial thinking may be worth preserving. However, this selection should be treated as a hypothesis—not proof of behavioral function. The team still needs to compare it with the observable antecedents, consequences, student responses, and other information collected across incidents.
Begin with the ABC incident checklist. Staff members can use the printable or clickable version to record information as soon as practical after an incident. The form provides common options that can be selected quickly, along with space for notes when the checkboxes do not tell the full story.
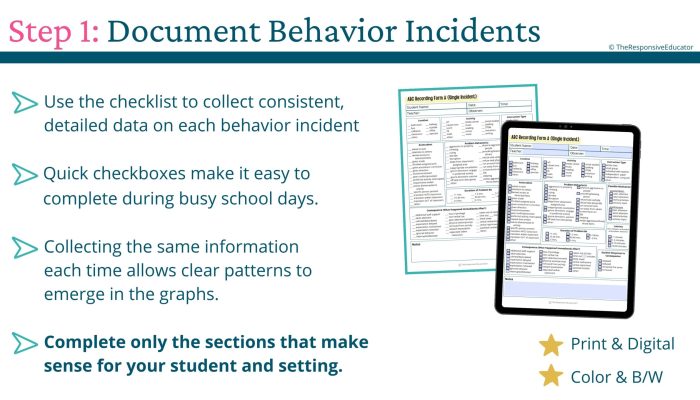
The checklist allows staff to document:
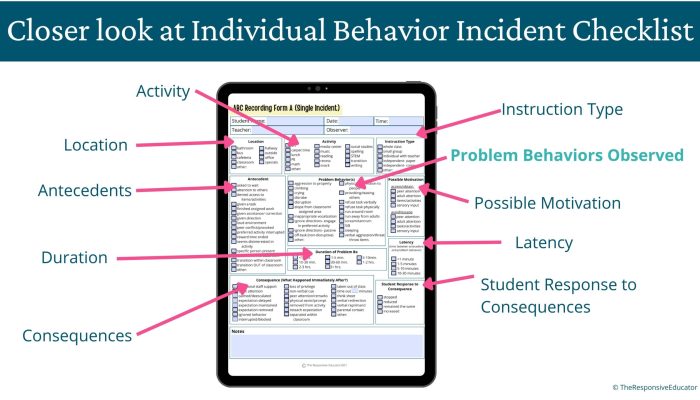
The checkboxes make data collection more manageable, but they do not eliminate the need for professional judgment. Select only the categories supported by what was observed, and use the notes section to record important details. If the student was asked to complete a ten-problem worksheet, for example, that detail may be more useful than simply checking “academic demand.”
Staff members should also avoid assuming that the antecedent caused the behavior. If a difficult assignment was presented immediately before an incident, record the assignment as the antecedent. The team can later examine whether similar demands repeatedly appear across reports.
For complete examples of objective and subjective entries, see Antecedent Behavior Consequence Chart Examples: How to Write Better ABC Data.
After collecting incident reports across representative days, activities, and settings, enter the total number of documented occurrences for each behavior into the spreadsheet. The behavior-count graph is created automatically, allowing the team to compare how often the listed behaviors were reported.
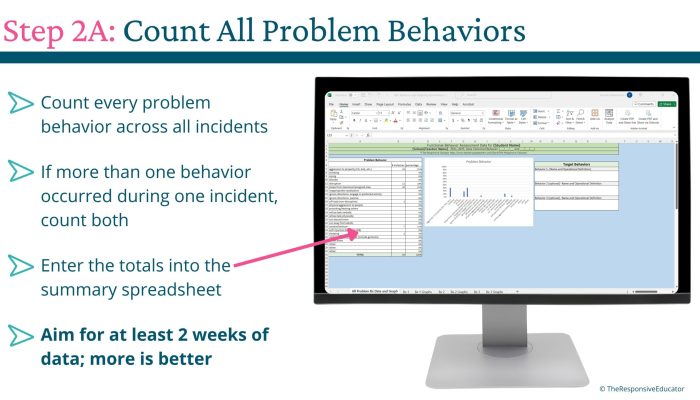
The spreadsheet recommends collecting at least two weeks of information as a practical starting point. Two weeks is not a universal rule, however. What matters is whether the team has enough representative information to make a responsible decision. Five reports from the same class period may tell the team less than five reports collected across several relevant settings.
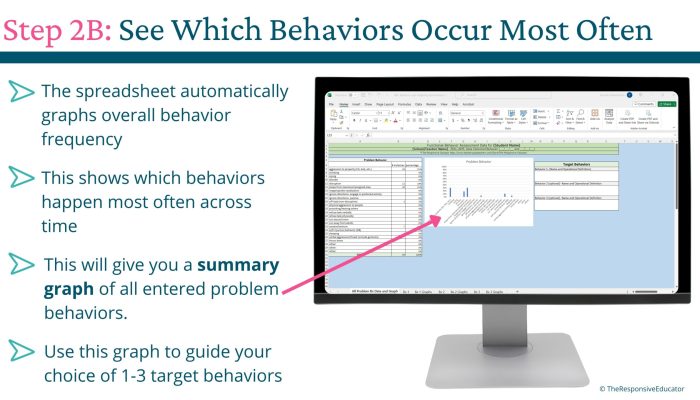
Frequency should also not be the only factor used to select target behaviors. A behavior involving significant safety concerns may need attention even if it occurs less often than calling out or work refusal. Teams should consider safety, intensity, disruption, educational impact, and frequency when prioritizing behaviors for closer examination.
The graph helps organize that decision; it does not make the decision for the team.
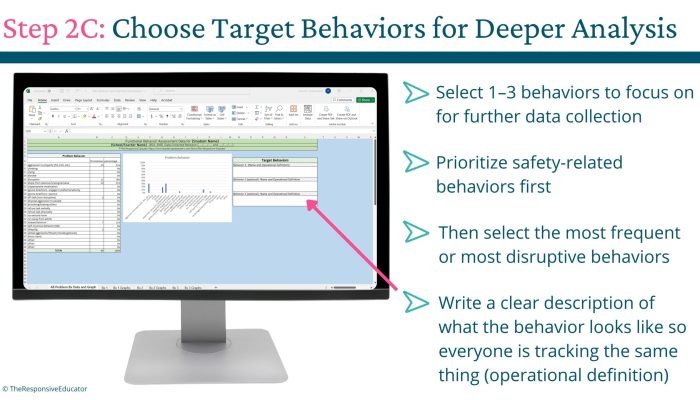
Before entering the detailed data, write a clear definition of each target behavior. The definition should describe what the behavior looks or sounds like and make it possible for different staff members to recognize it consistently.
For example, “aggression” may be too broad. A clearer definition might be:
Hitting, kicking, biting, scratching, or throwing an object toward another person.
A definition of work refusal might state:
The student verbally says no, pushes the assigned materials away, puts their head down, or does not begin within two minutes of the direction after the direction and needed materials have been provided.
Clear definitions improve the quality of the incident reports and make the completed graphs more defensible. They also help the team distinguish between behaviors that may look similar but require different instruction or support.
Once the team has selected and clearly defined the target behaviors, each behavior receives its own sheet within the spreadsheet. This keeps information surrounding one behavior from being mixed with information about an unrelated behavior.
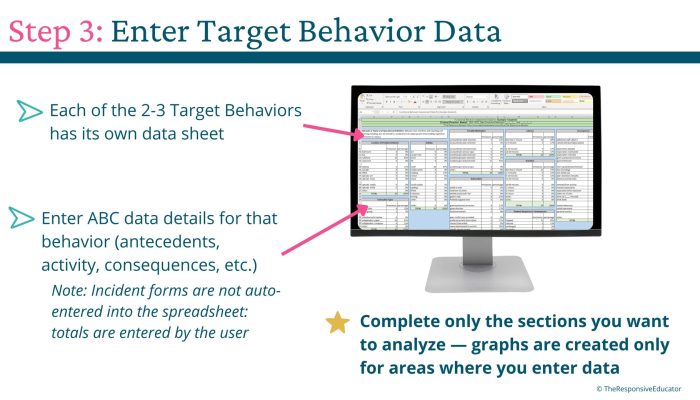
Use the individual target-behavior sheets to enter the information collected about each occurrence. Depending on what was recorded, this may include the location, activity, instruction type, antecedent, consequence, duration, latency, possible motivation, and student response.
Consistency matters during this step. Use the same categories for similar events, and check the original report when an entry is unclear. Avoid changing a response to fit an emerging theory about the behavior. The purpose of entering the data is to discover possible patterns, not to confirm what the team already believes.
If several staff members are entering data, it may help to designate one person to review the entries for consistency. That person is not changing what observers reported. They are checking that the categories and behavior definitions are being applied in the same way across reports.
As the information is entered, the spreadsheet creates graphs for each target behavior. The system can generate up to ten types of graphs:
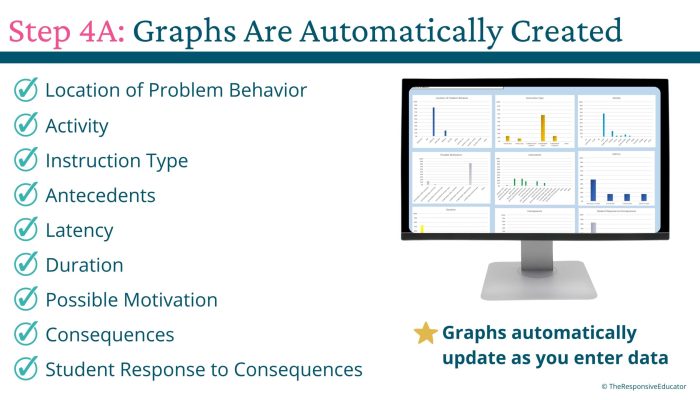
You do not have to use every graph simply because it is available. Select the graphs that help answer the team’s current questions.
Location, activity, and instruction-type graphs help the team examine the context in which incidents were documented. They may show that a behavior was reported more often in a particular setting, during a specific activity, or with one type of instruction.
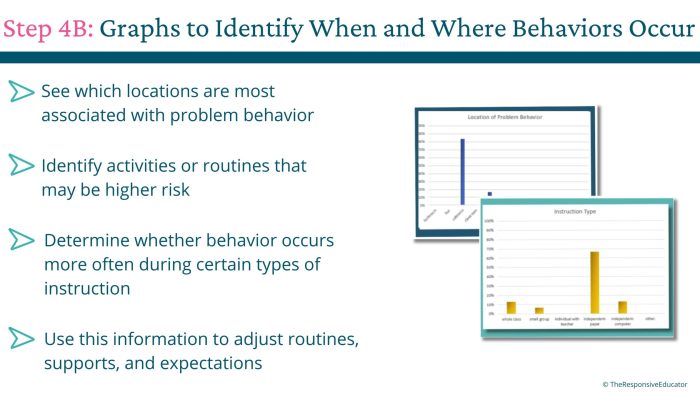
Raw counts still need context. If more incidents were documented during reading than science, consider how much time the student spends in each activity and how often the relevant situations occurred. A larger total may reflect greater exposure rather than a stronger relationship between reading and the behavior.
Antecedent, consequence, and student-response graphs help the team examine repeated sequences surrounding the behavior. These patterns can raise useful questions about what may be influencing the behavior and what the team should investigate more closely.
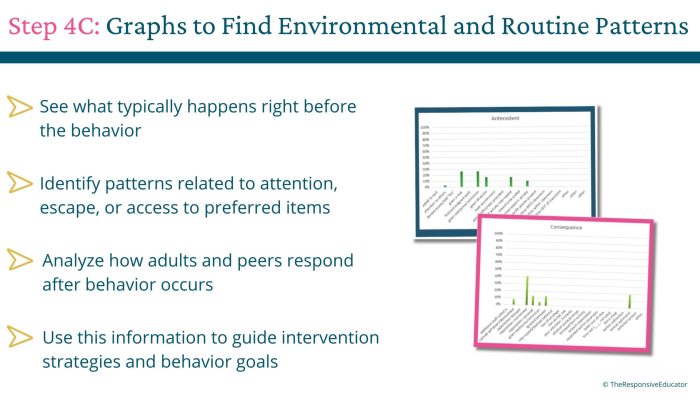
Duration and latency graphs provide information about how long the behavior lasted or how quickly it followed an event or direction. The possible-motivation graph requires particular caution because it summarizes the motivations observers selected on the incident reports. It does not independently calculate or prove the function of the behavior.
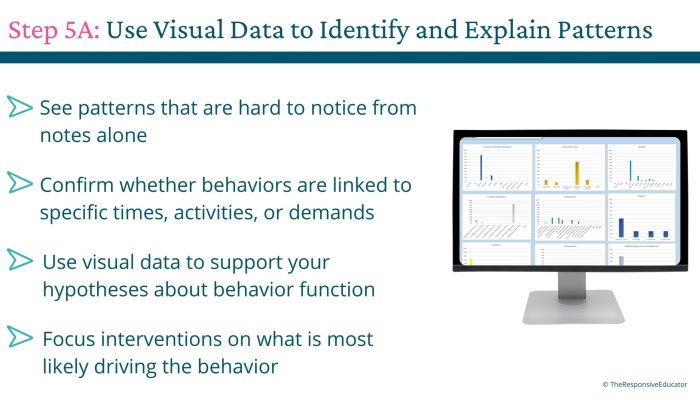
ABC behavior graphs help us see patterns that deserve further investigation. They organize the evidence, but they do not replace professional analysis.
Once the team has reviewed the graphs, identify the patterns that appear consistently and the questions that still need to be answered. A graph may show that a behavior is often documented during independent work, after a difficult task is presented, or before the student is removed from an activity. That information gives the team a direction for further investigation.
The graphs can be added to an FBA report, discussed during an IEP or problem-solving meeting, used to help develop a function-based BIP, or shared with relevant team members. They provide a visual summary of the information collected, but they should be accompanied by written context and professional interpretation.
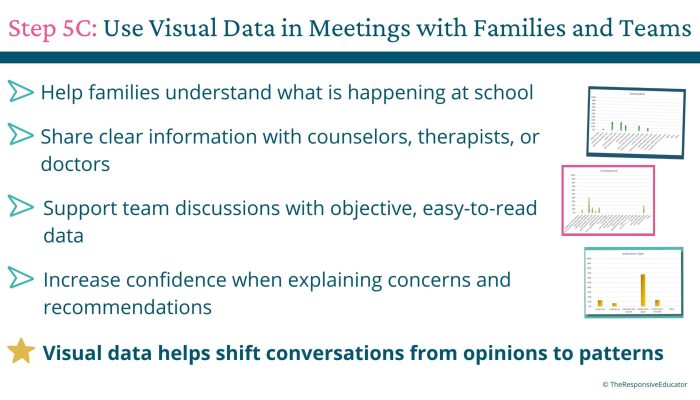
Classroom teachers often contribute essential direct-observation data to an FBA. That does not mean a new classroom teacher is expected to determine behavioral function independently or conduct the entire formal assessment. The forms and graphs help teachers provide organized information that a qualified team can evaluate alongside interviews, records, observations, academic information, and other sources.
If you want a connected system for collecting incidents, organizing the information, and automatically creating the graphs, you can view the complete ABC Data Sheet Editable and Digital Graphing System and decide whether it fits your team’s data-collection process.
A simple blank ABC data sheet may be enough when one person is collecting information about a small number of incidents. The process becomes more difficult when several people are collecting data, multiple behaviors are being documented, or the team needs to compare reports across settings and activities.
This system may be particularly helpful when:
The system is intentionally detailed because behavior rarely occurs in a vacuum. As one reviewer described the resource, “This product is incredibly comprehensive.” The different forms and graphs allow teams to choose the information that is relevant rather than relying on one limited view of the behavior.
If you only need a basic blank form for an occasional incident, you may not need the complete system. Its greatest value is helping teams organize and examine information across multiple reports.
The resource was created for educators and school teams that need a structured way to collect and present behavior information. Special education teachers, school psychologists, behavior specialists, BCBAs, counselors, intervention teams, and other qualified professionals may use different parts of the system based on their roles.
General education teachers and paraprofessionals may also use the incident-reporting forms when they have been given clear behavior definitions and guidance about what to document. Their observations can provide valuable information because they often see the student across activities and naturally occurring classroom situations.
The purpose is not to turn every staff member into a behavior analyst. It is to make it easier for the people who know the student to contribute accurate, useful information to the team.

A Functional Behavior Assessment brings together information from several sources, which may include record reviews, interviews, direct observations, ABC data, and other behavior measurements. Each source contributes something different. Individual ABC reports show what happened during specific incidents, while graphs help the team see what is happening across many incidents.
When teams review pages of ABC data, repeated patterns can be difficult to recognize. A graph can make it easier to see whether a behavior occurs more often during a particular activity, type of instruction, location, or time of day. It can also highlight antecedents and consequences that appear repeatedly, along with patterns in duration, latency, or the student’s response to what happened afterward.
These visual patterns do not prove why a behavior is occurring. They give the team evidence to compare with interviews, observations, records, and other sources of information. When several sources point toward the same pattern, the team has a stronger basis for developing a hypothesis about the behavior’s likely function.
Graphs are also useful because they make complex information easier to communicate. Rather than asking families, teachers, administrators, and other team members to interpret rows of raw data, you can give them a visual summary and then explain the context behind it. This can lead to more focused FBA discussions and a clearer connection between the evidence collected and the supports included in the Behavior Intervention Plan.
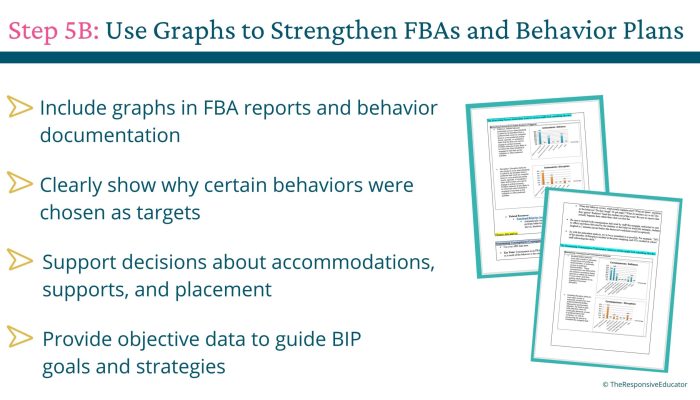
A Functional Behavior Assessment brings together information from several sources, which may include record reviews, interviews, direct observations, ABC data, and other behavior measurements. Each source contributes something different. Individual ABC reports show what happened during specific incidents, while graphs help the team see what is happening across many incidents.
When teams review pages of ABC data, repeated patterns can be difficult to recognize. A graph can make it easier to see whether a behavior occurs more often during a particular activity, type of instruction, location, or time of day. It can also highlight antecedents and consequences that appear repeatedly, along with patterns in duration, latency, or the student’s response to what happened afterward.
These visual patterns do not prove why a behavior is occurring. They give the team evidence to compare with interviews, observations, records, and other sources of information. When several sources point toward the same pattern, the team has a stronger basis for developing a hypothesis about the behavior’s likely function.
Graphs are also useful because they make complex information easier to communicate. Rather than asking families, teachers, administrators, and other team members to interpret rows of raw data, you can give them a visual summary and then explain the context behind it. This can lead to more focused FBA discussions and a clearer connection between the evidence collected and the supports included in the Behavior Intervention Plan.
The ABC Behavior Charting system was designed to make that part of the process more manageable. It organizes the information collected across incidents and automatically creates graphs for behavior frequency, location, activity, instruction type, antecedents, consequences, duration, latency, possible motivation, and the student’s response to consequences. You still bring the professional judgment and interpret the information within the full context of the student, but you do not have to build each graph by hand.
Manually reviewing incident reports and building graphs can take hours, especially when several behaviors or settings are involved. The ABC Data Sheet Editable and Digital Graphing System brings the forms, spreadsheets, and graphs into one process so you do not have to piece together separate resources.
The system includes printable and clickable incident-reporting options, behavior-count analysis, individual sheets for two or three target behaviors, and automatically generated graphs. Because the spreadsheet is editable, you can adapt the categories to better fit the student, setting, or questions your team is examining.
If that is the kind of support your team needs, you can view the complete ABC Data Sheet Editable and Digital Graphing System and decide whether it fits your data collection process.
An organized graph can make a complicated set of reports easier to understand, but its value does not come from how polished it looks. Its value comes from helping the team recognize what it knows, what it does not yet know, and what questions should be investigated next.
Use the graphs to look beyond isolated incidents and assumptions. Examine the conditions under which behavior is more and less likely, consider what adults can change, and identify the skills the student may need to learn. When ABC behavior charting is used thoughtfully, it gives the team a clearer foundation for building support that helps the student become more successful and independent.
For additional articles about frequency, rate, duration, interval, and ABC data collection, visit the Behavior Data Collection Hub. If your team is ready to move into the formal assessment process, continue with What Is a Functional Behavior Assessment?


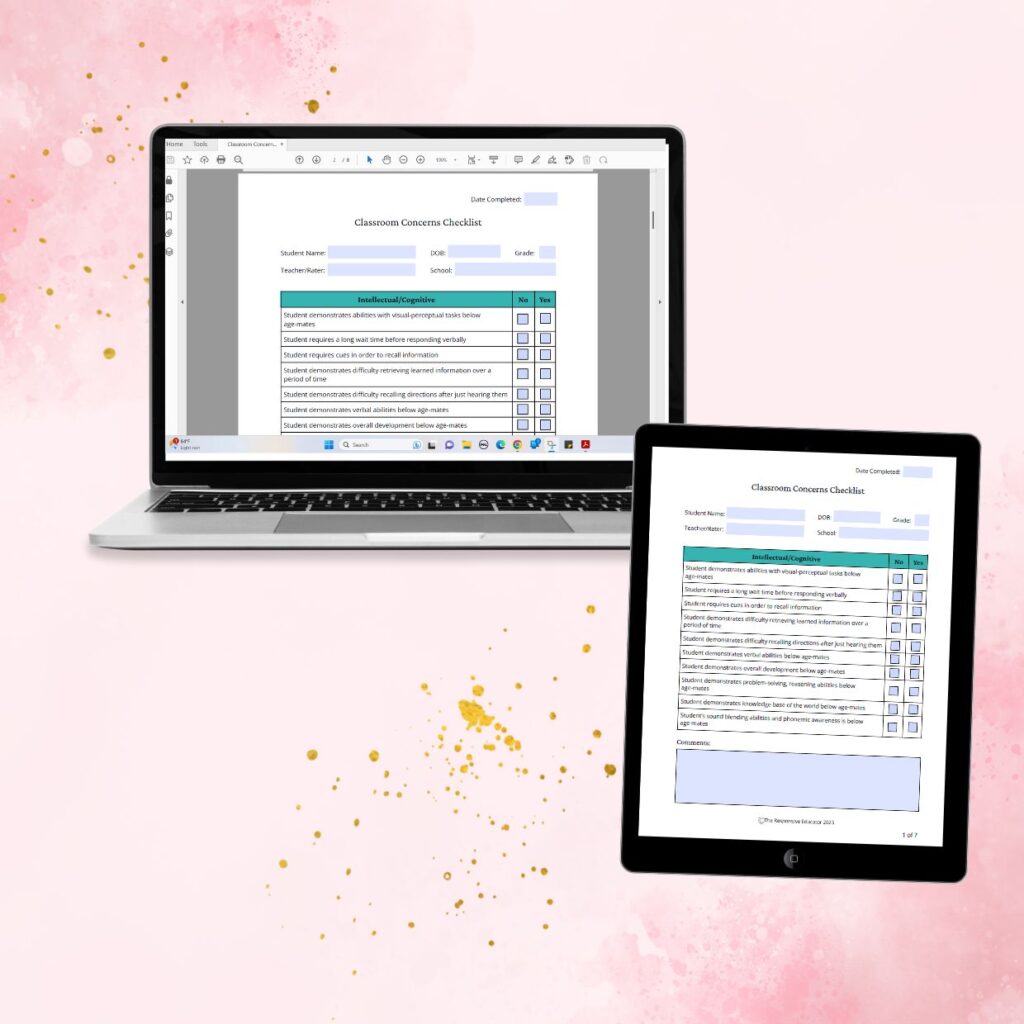
Support your students’ individual needs with our exclusive Classroom Concerns Checklist.
Identify key concerns in areas like cognitive skills, communication, social/emotional behavior, and more.
Sign up now to receive instant access and valuable insights on addressing classroom concerns.
Don’t miss out, join our community today!

Support your students’ individual needs with our exclusive Classroom Concerns Checklist.
Identify key concerns in areas like:
…and more to help drive collaboration and problem-solving.
Sign up now to receive instant access and valuable insights on addressing classroom concerns.