You have collected several ABC incident reports. Each one tells you what happened before a behavior, what the student did, and what happened immediately afterward.
Now what?
This is where many teams get stuck. Teachers and other staff members spend valuable time collecting ABC data, but the completed reports remain in a folder, binder, or digital file. The information has been documented, but no one has brought the observations together to determine what keeps happening.
One ABC incident report tells you what happened during one situation. Multiple reports begin telling you what usually happens.
That is when an Antecedent Behavior Consequence Chart becomes more than a documentation form. Reviewing several charts together can help a team identify repeated antecedents, consequences, activities, settings, and student responses that would be difficult to recognize from memory alone.
Before looking for patterns, make sure the original entries are clear and objective. What Is an ABC Behavior Chart? explains what belongs on the form, while Antecedent Behavior Consequence Chart Examples shows what useful entries look like in real classroom situations.
In the first three articles of this series, we built the foundation for collecting meaningful ABC data:
The next step is to examine what repeats across those observations.
One of my earliest experiences as a behavior specialist taught me how important that distinction is. I was asked to observe a first-grade student whose disruptive behavior was significantly affecting instruction. After completing several observations, I believed the behavior was most likely related to adult attention. During the team meeting, however, the principal disagreed. She did not believe attention was the likely function.
Fortunately, the school psychologist continued collecting ABC data. When we reviewed her observations alongside mine, the same patterns continued to appear. Similar events preceded the behavior, similar adult responses followed it, and the student responded in similar ways. The conversation changed because we were no longer debating which person had interpreted the student correctly. We were looking at a pattern supported by multiple observations.
Behavior-support decisions should not depend on the most memorable incident or the strongest opinion in the room. They should be guided by patterns that remain reasonably consistent across time.
It is natural to read one ABC behavior chart and begin forming ideas about why the behavior occurred. Sometimes those first impressions eventually prove accurate. Other times, they reflect one unusually difficult moment rather than a dependable pattern.
Imagine a student who refuses an assignment. On Monday, the refusal may follow an unusually difficult morning. On Wednesday, the assignment may require skills the student has not mastered. On Friday, the student may have argued with a peer shortly before class. If you examined only one incident, you might develop a very different explanation depending on which day you observed.
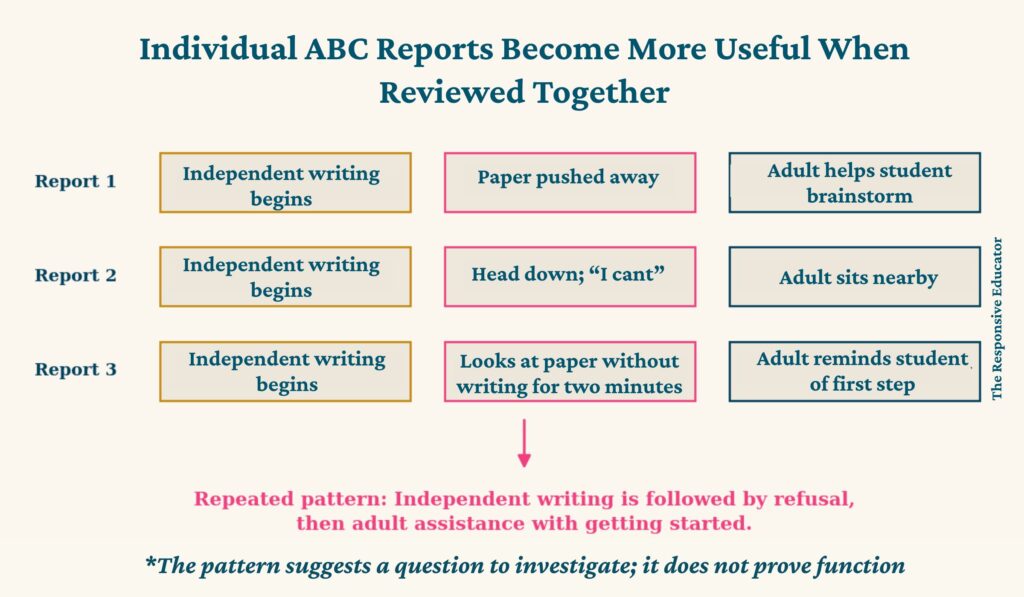
As additional ABC behavior data is collected, the larger picture may become clearer. You may discover that refusal occurs primarily during independent writing, rarely happens during small-group instruction, and is usually followed by an adult helping the student get started.
That pattern does not prove why the behavior occurs. It gives the team a more specific question to investigate:
Why does refusal occur so consistently when the student is expected to begin writing independently?
That question is much more useful than asking why the student refuses work in general.
Before analyzing several reports, make sure the information is organized well enough to compare. Pattern analysis becomes difficult when behaviors are defined differently from one report to another or when important sections are regularly left blank.
Begin by checking whether:
The data does not need to be perfect. Classroom data rarely is. However, major inconsistencies should be recognized before the team treats the totals or graphs as precise.
If one observer records every verbal refusal separately while another records an entire 30-minute episode as one incident, their frequency totals cannot be compared without clarification. The difference may reflect the counting system rather than a change in the student’s behavior.
When I review ABC incident reports, one of the first questions I ask is:
What keeps happening immediately before the behavior?
Do not focus only on the antecedent from the most serious incident. Look across the observations for events that appear repeatedly.
You may notice that the behavior frequently follows:
At this stage, you are not deciding what caused the behavior. You are identifying conditions that deserve closer examination.
For example, “teacher direction” may appear as the antecedent on several reports. That does not mean the student behaves this way whenever any teacher gives a direction. Look more closely. Does the pattern occur during all directions or primarily when directions involve independent academic work? Does it happen after private prompts, public correction, multi-step directions, or transitions away from preferred activities?
A broad pattern points you toward a more specific question. That question guides the next part of the investigation.
Sometimes the immediate antecedent is not the only important pattern. The activity, location, time, or instructional format may provide additional context.
A student may demonstrate the same behavior:
This does not mean the location, teacher, or subject caused the behavior. It means the conditions are different enough to investigate.
Suppose most incidents occur in the general education classroom. Before deciding that the classroom is the problem, consider how much time the student spends there. If the student is in that setting for six hours and in the resource room for 30 minutes, a higher number of incidents in the classroom would be expected.
Raw totals need context. Ask whether the student had equal time or equal opportunities to demonstrate the behavior in each setting. When exposure differs greatly, frequency totals alone may create a misleading picture.

nce you have examined what tends to happen before the behavior, ask:
What keeps happening immediately afterward?
Within ABC data, a consequence is not limited to punishment or discipline. It is the immediate response or outcome that follows the behavior.
Across several reports, you may notice that the student consistently:
Repeated consequences matter because they show what the behavior consistently produces in the environment. However, the consequence does not automatically prove the function.
Imagine that a student regularly receives individual assistance after refusing writing work. One interpretation is that the behavior is maintained by adult attention. Another possibility is that the student does not have the skills needed to begin the assignment independently.
The pattern tells the team that adult assistance regularly follows refusal. It does not tell the team, by itself, why the student needs or seeks that assistance.
Many basic ABC charts end after the consequence. I have found that recording the student’s response gives the team another valuable piece of information.
Ask what happened after the adult or peer responded:
Suppose a student yells during independent work. On one occasion, an adult provides a quiet prompt and the student begins working. On another, peers laugh and the student continues yelling. On a third, the assignment is removed and the student becomes calm.
Those responses do not establish the function, but they help the team examine how different outcomes may be related to what happens next.
Frequency tells you how many incidents occurred, but two incidents can look very different when duration is considered.
A student may experience three episodes of emotional escalation during a week. If each episode lasts two minutes, the effect is different from three episodes lasting 45 minutes each. Recording duration helps the team avoid treating every incident as equal simply because it received one tally.
Latency can also provide useful context. Latency is the amount of time between the antecedent and the beginning of the behavior. A student who refuses immediately after a task is presented may demonstrate a different pattern from a student who works for 15 minutes before becoming disengaged.
Not every behavior requires frequency, duration, and latency. Collect the measurements that help answer the team’s question rather than gathering every possible number.
Organized data can occasionally reveal that the behavior everyone has been discussing is not the behavior having the greatest effect on safety, learning, or participation.
A student once transferred into my behavior program with an existing Functional Behavior Assessment and Behavior Intervention Plan. As I reviewed the paperwork, I noticed that physical aggression was not listed as a target behavior even though the student appeared to engage in it frequently.
When I reviewed the previous discipline referrals, I found the problem. Staff members could choose only one behavior code for each referral. Most incidents had been coded as defiance or noncompliance, even though the written narratives described verbal aggression, property destruction, elopement, and physical aggression during the same events.
Once I tallied the behaviors described in the narratives, physical aggression appeared far more often than the referral codes suggested. The way the information had been categorized had hidden an important safety concern.
That experience changed the direction of the student’s FBA and BIP. It also reinforced an important lesson: the way we organize behavior data affects the problems we identify and, ultimately, the support students receive.
Selecting target behaviors will be addressed more fully in the FBA series. For now, remember that the behavior documented most often is not automatically the one that deserves the greatest attention. Safety concerns and the effect on learning and participation must also be considered.

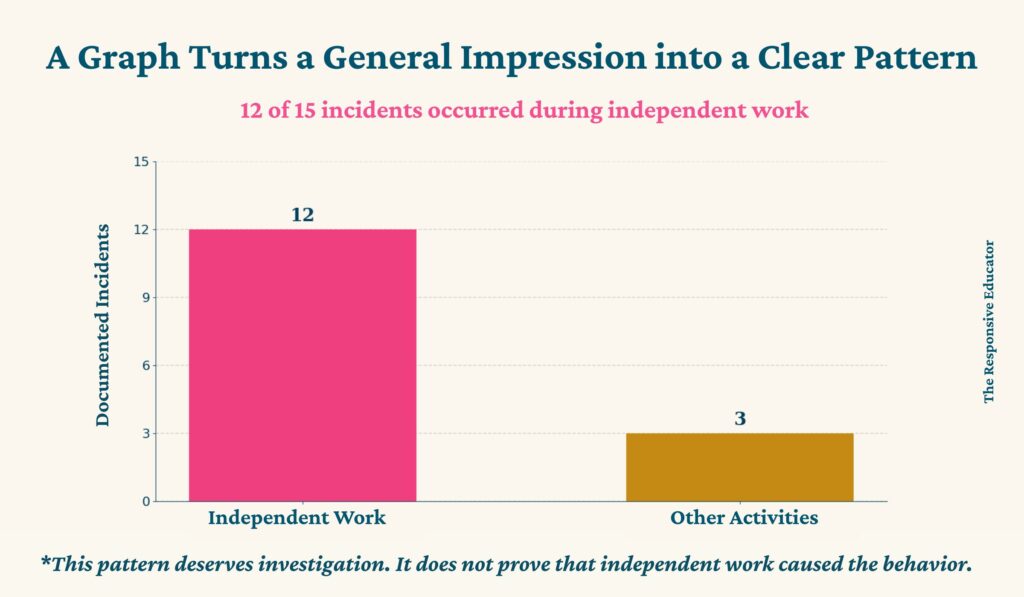
Our brains are only so good at comparing information across pages of incident reports. You may read fifteen reports and have a general impression that most behaviors occur during independent work. Once the information is organized into a graph, that pattern becomes much easier to see and communicate.
When I moved from running self-contained behavior programs into a district behavior-specialist role, I was surprised by how few specialists were graphing their ABC data. People were working hard and collecting information, but much of it remained buried inside individual reports.
That made it harder to recognize patterns, explain conclusions to teams, and advocate for students using clear evidence.
Graphs can help summarize:
The graph does not interpret the information for you. It organizes the data so repeated conditions become easier to recognize.
A graph can change a vague statement into a more focused discussion. Instead of saying:
I think this usually happens during independent work.
You may be able to say:
Twelve of the fifteen documented incidents occurred during independent work over the past three weeks.
That does not prove that independent work caused the behavior. It gives the team a pattern to investigate. The next questions might involve the difficulty of the work, the student’s ability to begin independently, the length of the assignment, available supports, or the way instructions were presented.
Graphs also help ensure that teachers, administrators, specialists, and families are looking at the same information. Team members may still interpret the pattern differently, but the discussion begins with shared evidence rather than different memories of individual incidents.
A graph can look precise even when the underlying data has important limitations. Before drawing conclusions, ask:
Suppose 70% of documented incidents occurred during math. That could indicate an important pattern. It could also reflect that math was observed more often, lasted longer, or had more staff members consistently completing reports.
Graphs make patterns visible. Professional judgment determines what questions those patterns raise.
Sorting through incident reports manually can take a great deal of time, particularly when you are comparing behaviors, locations, activities, instruction types, antecedents, consequences, duration, latency, and student responses.
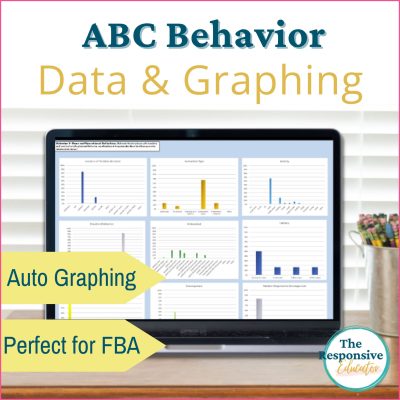
That challenge is why I created my ABC Data Sheet Editable and Digital Graphing System. Staff members can use the printable or clickable incident reports to document individual events and then enter the information into the editable spreadsheet. The system organizes the data and generates up to ten types of graphs so teams can examine patterns without building each graph manually.
The graphs do not determine the function or make decisions for the team. They make it easier to see which information repeats and communicate those patterns to the people involved in the student’s support.
For teams collecting ABC data as part of an FBA, this can reduce the time spent sorting and graphing information while still preserving the professional judgment required to interpret it accurately.
If you already own—or are considering—this resource, How to Use ABC Behavior Charting Graphs: A Step-by-Step Guide walks through the incident forms, target behavior sheets, spreadsheet, and automatically generated graphs in order.
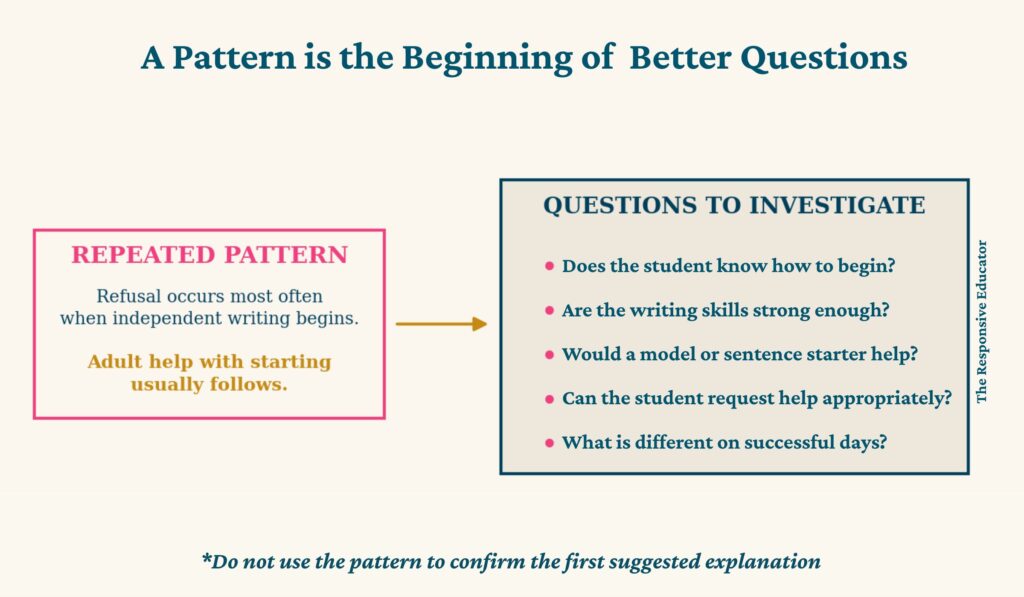
Finding a pattern is not the same as finding the answer.
Suppose several weeks of ABC behavior data show that disruptive behavior occurs most often when independent writing begins. The reports also show that an adult usually approaches, provides individual assistance, and helps the student begin.
At first glance, the team may conclude that the behavior is maintained by adult attention. That may be true, but the same pattern could have another explanation. The student may have difficulty organizing ideas, writing the first sentence, understanding the prompt, or beginning a multi-step task independently.
The pattern should lead the team toward questions such as:
Those questions move the team closer to understanding the student. They also prevent the ABC data from being used to confirm the first explanation someone suggested.
ABC incident reports naturally focus on times when challenging behavior occurred. That creates an important limitation: the reports may tell you a great deal about difficult moments while telling you very little about the times the student was successful.
Suppose every documented incident occurred during independent writing. That sounds meaningful, but you still need to know how often independent writing occurred without the behavior. If the student completed independent writing successfully on 18 other days, the pattern looks different than if the behavior occurred during nearly every writing period.
Ask what was different when the student succeeded:
Understanding successful conditions helps the team identify supports and skills that may already be working. Behavior assessment should not focus so heavily on failure that it overlooks evidence of what helps the student succeed.
Repeated antecedents and consequences provide clues about the possible function of behavior. They do not establish the function with complete certainty.
ABC data is one source of information within a larger assessment process. A Functional Behavior Assessment may also include:
Each source answers a different question. When several sources begin pointing in the same direction, the team can develop a stronger hypothesis about the function of behavior. This distinction protects students from decisions based on incomplete information. It also keeps teams curious. Instead of using ABC data to prove what we already believe, we use it to determine what additional information we need.
Teachers often ask how many ABC reports they need before they can identify a pattern or move forward with an FBA. There is no magic number. The amount needed depends on how frequently the behavior occurs, how consistent the observations are, how many settings are involved, and how important the decision will be.
Rather than focusing only on the number of completed forms, ask whether the information is beginning to tell a reasonably consistent story:
If the data remains inconsistent or incomplete, additional observations may be necessary. If repeated patterns are appearing across several sources, the information may be ready to make a meaningful contribution to the FBA process.

Collecting objective reports is only the first step. The way the information is interpreted also affects the team’s decisions.
One incident may suggest a possibility, but it does not establish a pattern. Look across multiple observations before reaching conclusions about antecedents, consequences, or possible function.
If independent work appears most often, that does not mean independent work caused the behavior. It identifies a condition that deserves closer investigation.
A behavior may appear most often in the setting where the student spends the most time. Compare exposure and opportunities before deciding that one location, activity, or person is uniquely associated with the behavior.
A student receiving attention after a behavior does not automatically mean the behavior occurred to obtain attention. The consequence is one clue that must be considered alongside the antecedent, student skills, context, and other assessment information.
A graph organizes data. It cannot determine the function, select an intervention, or replace professional judgment.
ABC incident reports often exclude times when the student met the same expectation successfully. Examining successful conditions provides essential context and may reveal supports the team can build upon.
It is easy to notice evidence that supports what we already believe. Ask what other explanations could fit the same pattern and what additional information would help the team distinguish among them.
ABC data is ready to support the FBA process when it helps the team describe a reasonably consistent pattern and identify specific questions that need further investigation.
The team should understand:
The goal is not to enter the FBA process believing you have already solved the behavior. It is to enter with organized information that allows the team to conduct a more focused and responsible investigation.
The next part of the Behavior Support Framework will move into Functional Behavior Assessments. We will examine what an FBA is, what sources of information belong in one, how teams determine the likely function of behavior, and how the findings eventually guide an effective Behavior Intervention Plan.
Individual ABC reports document moments. Reviewing them together helps us understand what keeps happening across those moments.
Look for repeated antecedents, consequences, activities, settings, instructional formats, duration, latency, and student responses. Graphs can make these patterns easier to see, but every graph must be interpreted within the context of how the information was collected. A large number of incidents during math, for example, means something different if the student spends most of the school day in math intervention than it would if math lasts only thirty minutes.
Most importantly, remember that a pattern is the beginning of a better question—not the end of the investigation. ABC data can suggest relationships and help a team develop a reasonable hypothesis, but it does not prove why a behavior occurs.
If you want a more manageable way to collect incident information and compare patterns across reports, my ABC Data Sheet Editable and Digital Graphing System includes printable and clickable forms along with an editable spreadsheet that organizes the data and creates graphs for you.
For some students, these classroom observations will be enough to guide smaller changes or determine what information should be collected next. When concerns are more complex or the team needs to formally examine the possible function of a behavior, the next step may be a functional behavior assessment. In What Is a Functional Behavior Assessment?, I explain what an FBA is, when schools use one, and how information such as ABC data contributes to the process.
The purpose of collecting and analyzing ABC data is not to reduce a student to a set of patterns. It is to move beyond assumptions and develop a more complete understanding of the student. That understanding gives the team a stronger foundation for identifying missing skills, changing conditions that make success more difficult, and developing support that helps the student become more successful and independent.


Support your students’ individual needs with our exclusive Classroom Concerns Checklist.
Identify key concerns in areas like cognitive skills, communication, social/emotional behavior, and more.
Sign up now to receive instant access and valuable insights on addressing classroom concerns.
Don’t miss out, join our community today!

Support your students’ individual needs with our exclusive Classroom Concerns Checklist.
Identify key concerns in areas like:
…and more to help drive collaboration and problem-solving.
Sign up now to receive instant access and valuable insights on addressing classroom concerns.