
Tracking and improving student behavior in school is essential for creating a positive learning environment. One effective method for doing so is through the use of interval graphing. Analyzing this type of data can help educators identify patterns in student behavior, whether you are collecting behavioral baseline data or working on completing a functional behavior assessment. It can also help to create targeted interventions to address problematic behavior. In this blog post, we will explore the basics of data and interval graphing and how it can be used in an educational setting.
Note: I am an Amazon Affiliate. If you purchase products through the links provided, I will earn a small commission at no extra cost to you, which helps support the blog.
Interval counting is a valuable tool for tracking student behavior, especially when it comes to behaviors that occur frequently over a period of time. These types of behaviors can be challenging to monitor continuously, as teachers often have other responsibilities and can’t be solely focused on one student.

With interval counting, teachers can choose a time frame (e.g. every five minutes) and quickly record whether a student is engaged in the targeted behavior or not during that interval. This method can be particularly useful for behaviors such as off-task behavior or talking out of turn, which may occur frequently but not necessarily constantly.
By taking data from the interval count and using it for interval graphing, teachers can get a more accurate picture of how often these behaviors are occurring and make more informed decisions about how to address them. For example, if a teacher notices that a student is off-task for a significant portion of the observation period, they may decide to provide more frequent check-ins or offer incentives for staying on task.
When it comes to interval data collection, there are two methods to choose from: whole interval and partial interval.
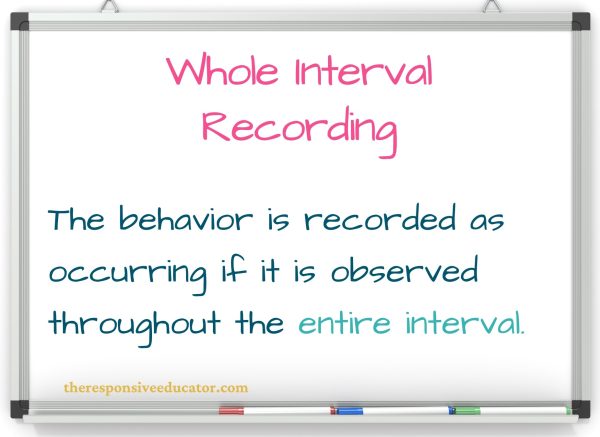
Whole interval recording is a method used to track behaviors that have a distinct beginning and end and occur over relatively long durations. This type of recording is particularly useful for behaviors that we aim to maintain and witness progress over time.
In the whole interval method, the behavior is recorded as present only if it is observed throughout the entire interval.
To illustrate, let’s consider a scenario where a student’s task is to sit quietly in their seat, and you decide to monitor this behavior in five-minute intervals for thirty minutes. You will do this multiple times per day for at least a week.
During each interval, the behavior would be marked as occurring only if the student maintains quiet sitting for the entire five-minute duration. If the student manages to sit quietly for four out of the five minutes, the behavior would not be marked as occurring because it was not sustained for the entire interval. At the end, you would be able to tell what percentage of five-minute intervals the student was able to successfully demonstrate the desired behavior.

It is important to be aware that whole interval data has what we might refer to as a bias toward underestimating behavior. To understand why, remember that whole interval data collection involves dividing the observation period into small intervals and recording whether the behavior occurred throughout each interval. Under this method, behavior is scored as present only if it occurs for the entire duration of the interval.
Whole interval data tends to underestimate behavior because it requires continuous engagement in the behavior throughout the entire interval. If the behavior is intermittent or sporadic, it may not be captured or scored as present because it did not occur for the full interval. This method is more suitable for measuring behaviors that are expected to occur continuously.
Whole interval data tends to underestimate behavior because it requires continuous engagement in the behavior throughout the entire interval. If the behavior is intermittent or sporadic, it may not be captured or scored as present because it did not occur for the full interval. This method is more suitable for measuring behaviors that are expected to occur continuously.
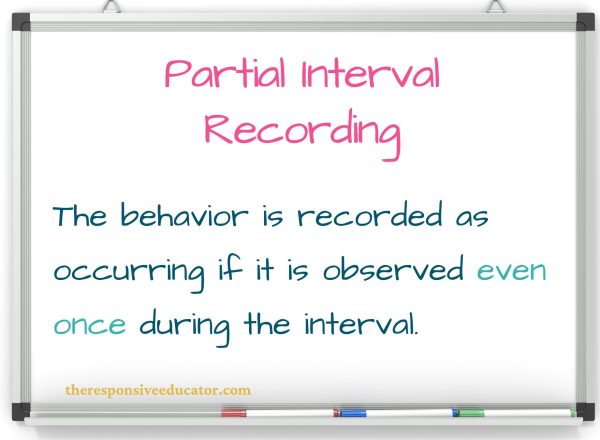
Partial interval recording is a suitable method for tracking behaviors that occur frequently in short bursts and do not have clearly defined beginnings and ends.
In partial interval recording, the behavior is recorded as present if it is observed at any point during the interval. Let’s take an example of a student who frequently calls out in class. In this case, whole interval recording wouldn’t be practical because the student’s behavior of calling out is unlikely to last for five minutes straight.
Instead, you can opt for partial interval recording to monitor the student’s talking out of turn. For instance, you can use five-minute intervals to track the behavior. In this approach, the behavior would be recorded as occurring if the student talks out of turn even once during the five-minute interval. By the end of a thirty-minute observation period, you would have collected six intervals of data.
Analyzing the data would help you assess whether you need to adjust the length of the intervals. For example, if the data reveals that the student talked out of turn in all six intervals during the thirty-minute observation period and you feel that this does not provide a clear enough picture of the behavior’s frequency, you may consider using two-minute intervals instead. This would yield fifteen data points within the same thirty-minute timeframe and potentially offer a more precise representation of the observed behavior.

While whole interval data has a bias toward underestimating behavior, partial interval data has a bias in the opposite direction. Remember that partial interval data collection involves dividing the observation period into intervals and recording whether the behavior occurred at any point during each interval. In this method, behavior is scored as present as long as it occurs at any time during the interval, regardless of the duration.
Partial interval data collection tends to overestimate behavior because even brief occurrences of the behavior are counted as present. If the behavior happens frequently but for short durations, it may be counted multiple times within an interval, leading to an inflated estimate of the behavior’s occurrence.
Both whole interval and partial interval data collection have their limitations and potential biases. Educators should carefully consider the nature of the behavior being measured and choose the data collection method that aligns best with the characteristics of the behavior in order to minimize bias and obtain accurate results.

Remember, the suitability of each method may vary depending on the specific context, behavior, and goals of data collection. It is important to consider the characteristics of the behavior in question when choosing between whole and partial interval data collection, or a different method such as frequency count.

Clearly define the behavior you want to observe and record. As always, it’s vital to clearly define the behavior you will be tracking to ensure consistency and accuracy in data collection. If you need help operationally defining target behaviors, see this post: How to Use Behavioral Baseline Data to Set Realistic Goals and Measure Success.
The choice between whole interval and partial interval data collection depends on the behavior being observed and the goal of the observation. As mentioned above, whole interval recording may be more appropriate for behaviors that need to be sustained over time, while partial interval recording may be more appropriate for behaviors that occur intermittently. Educators should consider the advantages and disadvantages of each type of data collection method to ensure that the data collected is accurate and reliable.

When collecting interval data to track and improve student behavior in school, it is important to determine the appropriate time frame for observation and baseline data collection.
This time frame should be long enough to provide useful information on the baseline level of the behavior before moving on to the intervention. Depending on the behavior being observed, plan on observing the behavior for a week or more, divided into smaller intervals.
For example, if you want to track a student’s on-task behavior, you may observe the student for multiple five-minute intervals over the course of a week, across subjects and times of day. This allows for a more thorough understanding of the behavior and may reveal patterns that may not be apparent in shorter observations. However, it is important to balance the length of the observation period with the practicality of collecting and analyzing the data.
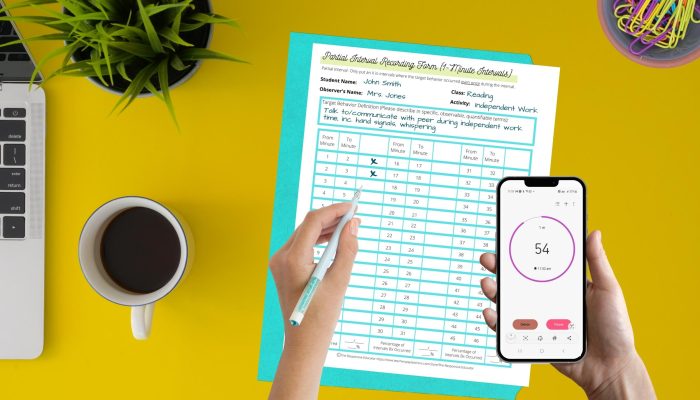
There are a variety of tools that can be used to track interval data in an educational setting. One simple method is to use a paper and pencil tally system, where the observer records each occurrence of the behavior during the designated time interval.
Another option is to use a digital data collection tool, such as an app or software program, which can simplify the data collection and analysis process.
Some schools also use behavior-tracking software or programs specifically designed for interval counting, which can provide additional features such as automatic data aggregation and graphing. Ultimately, the choice of tool will depend on the specific needs and resources of the school or individual user.
Analyzing data trends in student behavior interval data involves examining the patterns and changes in the occurrence of behaviors over time. Here are some steps to help you analyze the data:

It’s important to note that data analysis should be conducted in conjunction with a clear understanding of the behavior being measured, the context in which it occurs, and any specific goals or objectives you have set. The analysis process may vary depending on the specific research design, data collection methods, and desired outcomes.
When analyzing student behavior using interval data, graphing the data can help identify patterns and trends in the behavior’s occurrence. This approach can be particularly useful when analyzing both partial and whole interval data.


Graphing interval data in Excel can help identify patterns and trends in the occurrence of student behavior. For example, you might notice that a student’s off-task behavior decreases over time, or that there are certain times of day when disruptive behavior is more likely to occur. This information can be used to make data-driven decisions to support students and improve outcomes in the classroom.
When tracking behavioral data for a student, it is important to consider significant changes that occur either at home or at school. To better understand the impact of these changes on student behavior, it can be helpful to mark a line on your graph to indicate when the change took place. This allows you to identify the variables that may be influencing the behavior in a positive or negative way.
Examples of changes could include a new teacher or class assignment, as well as personal life events like relocation, parental divorce, or the initiation or discontinuation of medication. By acknowledging and tracking these changes, you can gain insights into the factors that contribute to shifts in student behavior over time.
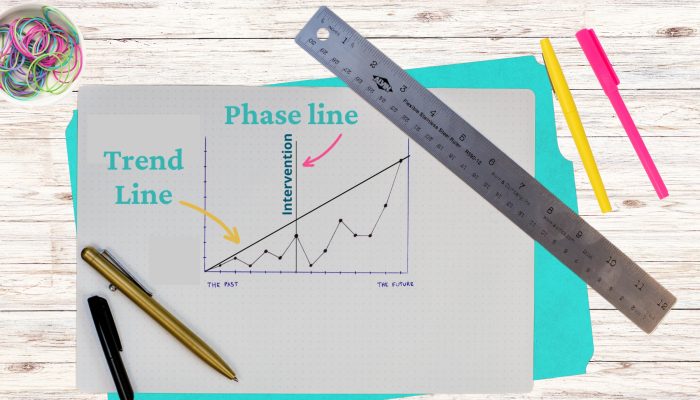
A trendline shows whether the data is trending upward or downward (in other words, is a behavior increasing or decreasing.
To include a trendline on your graph, click on the graph. Then click on the + that will appear in the upper right hand side of the graph and click the box for trendline.
Interval count data can be a powerful tool for educators and behavior specialists to identify problem behaviors and develop targeted interventions. By analyzing the data collected and comparing it to behavior baseline data, you can gain insights into when and where specific behaviors are occurring and determine the appropriate strategies to address them.

Suppose you are tracking a student’s on-task behavior throughout the school day using interval count data. By dividing the day into smaller intervals, such as 15-minute increments, you can record whether the student is on-task or off-task during each interval.
Interval graphing enables educators and behavior specialists to visually identify patterns, determine the effectiveness of interventions, and make data-driven decisions. By using interval count data, you can develop targeted interventions to support and improve student on-task behavior throughout the school day.
Interval counting is a behavior-tracking method that involves dividing an observation period into smaller time intervals and recording whether a specific behavior occurred or not within each interval. While interval counting can be a useful tool for tracking many behaviors, it may not be the most appropriate option in all situations.

One scenario where interval counting may not be suitable is when tracking behaviors that occur infrequently. For example, if the behavior of interest only occurs once or twice during a long observation period, using interval counting may not provide an accurate representation of the behavior. This is because the intervals may not coincide with the occurrences of the behavior, leading to underestimation or overestimation of the frequency of the behavior.
Another situation where interval counting may not be the best option is for behaviors that are difficult to define or quantify. For instance, it may be challenging to apply interval counting to behaviors such as fidgeting, restlessness, or anxiety, which do not have clearly defined start and end points.
Behaviors such as the ones listed above may require different tracking methods, such as duration recording or event recording, which allow for more detailed and nuanced observation of the behavior.
Keep in mind that, while interval counting is a valuable behavior-tracking method, it may not be the most appropriate option in all circumstances. When deciding on a tracking method, it is essential to consider the specific behavior being tracked and choose a method that is most accurate and informative for that behavior. If you would like an overview of the most common types of behavior data collection used in schools, take a look at my FREE resource, Data Collection for Behavior.
Interval graphing is a powerful tool that can help educators track and improve student behavior in school. The benefits of this method are clear: it provides objective, quantitative data that can help educators identify problematic behavior, track progress, and develop targeted interventions.
By using the step-by-step guide provided in this post, you can successfully implement interval counting in your classroom and develop interventions that address specific behavior issues. By continuing to use this method and making data-driven decisions, you can start to create a more positive and effective learning environment for all students.
Do you struggle with creating accurate and informative interval graphs in Excel? Look no further than Interval in Excel – the ultimate hassle-free solution for educators who want to track and graph student behavior data with ease.
With Interval in Excel, you can easily input behavior data and generate customizable interval graphs that help you track progress toward IEP goals and identify behavior patterns. Say goodbye to the time-consuming task of creating Excel graphs and hello to a product that simplifies behavior data collection and progress monitoring.
This product is incredibly user-friendly and comes with detailed instructions to help you get started. Plus, it’s fully customizable to fit your specific needs. With Interval in Excel, you can focus on what really matters – your students’ progress and success.
Don’t waste any more time struggling with creating interval graphs in Excel. Try Interval in Excel today and experience the difference it can make in your behavior data collection and progress monitoring. Click here to find it now!