Description
Duration Recording Data Sheets & Graphing
Frequency counts don’t always show the full picture. A behavior may happen just as often but last much less time. Without recording its duration, you could miss meaningful progress or changes that affect learning and instruction.
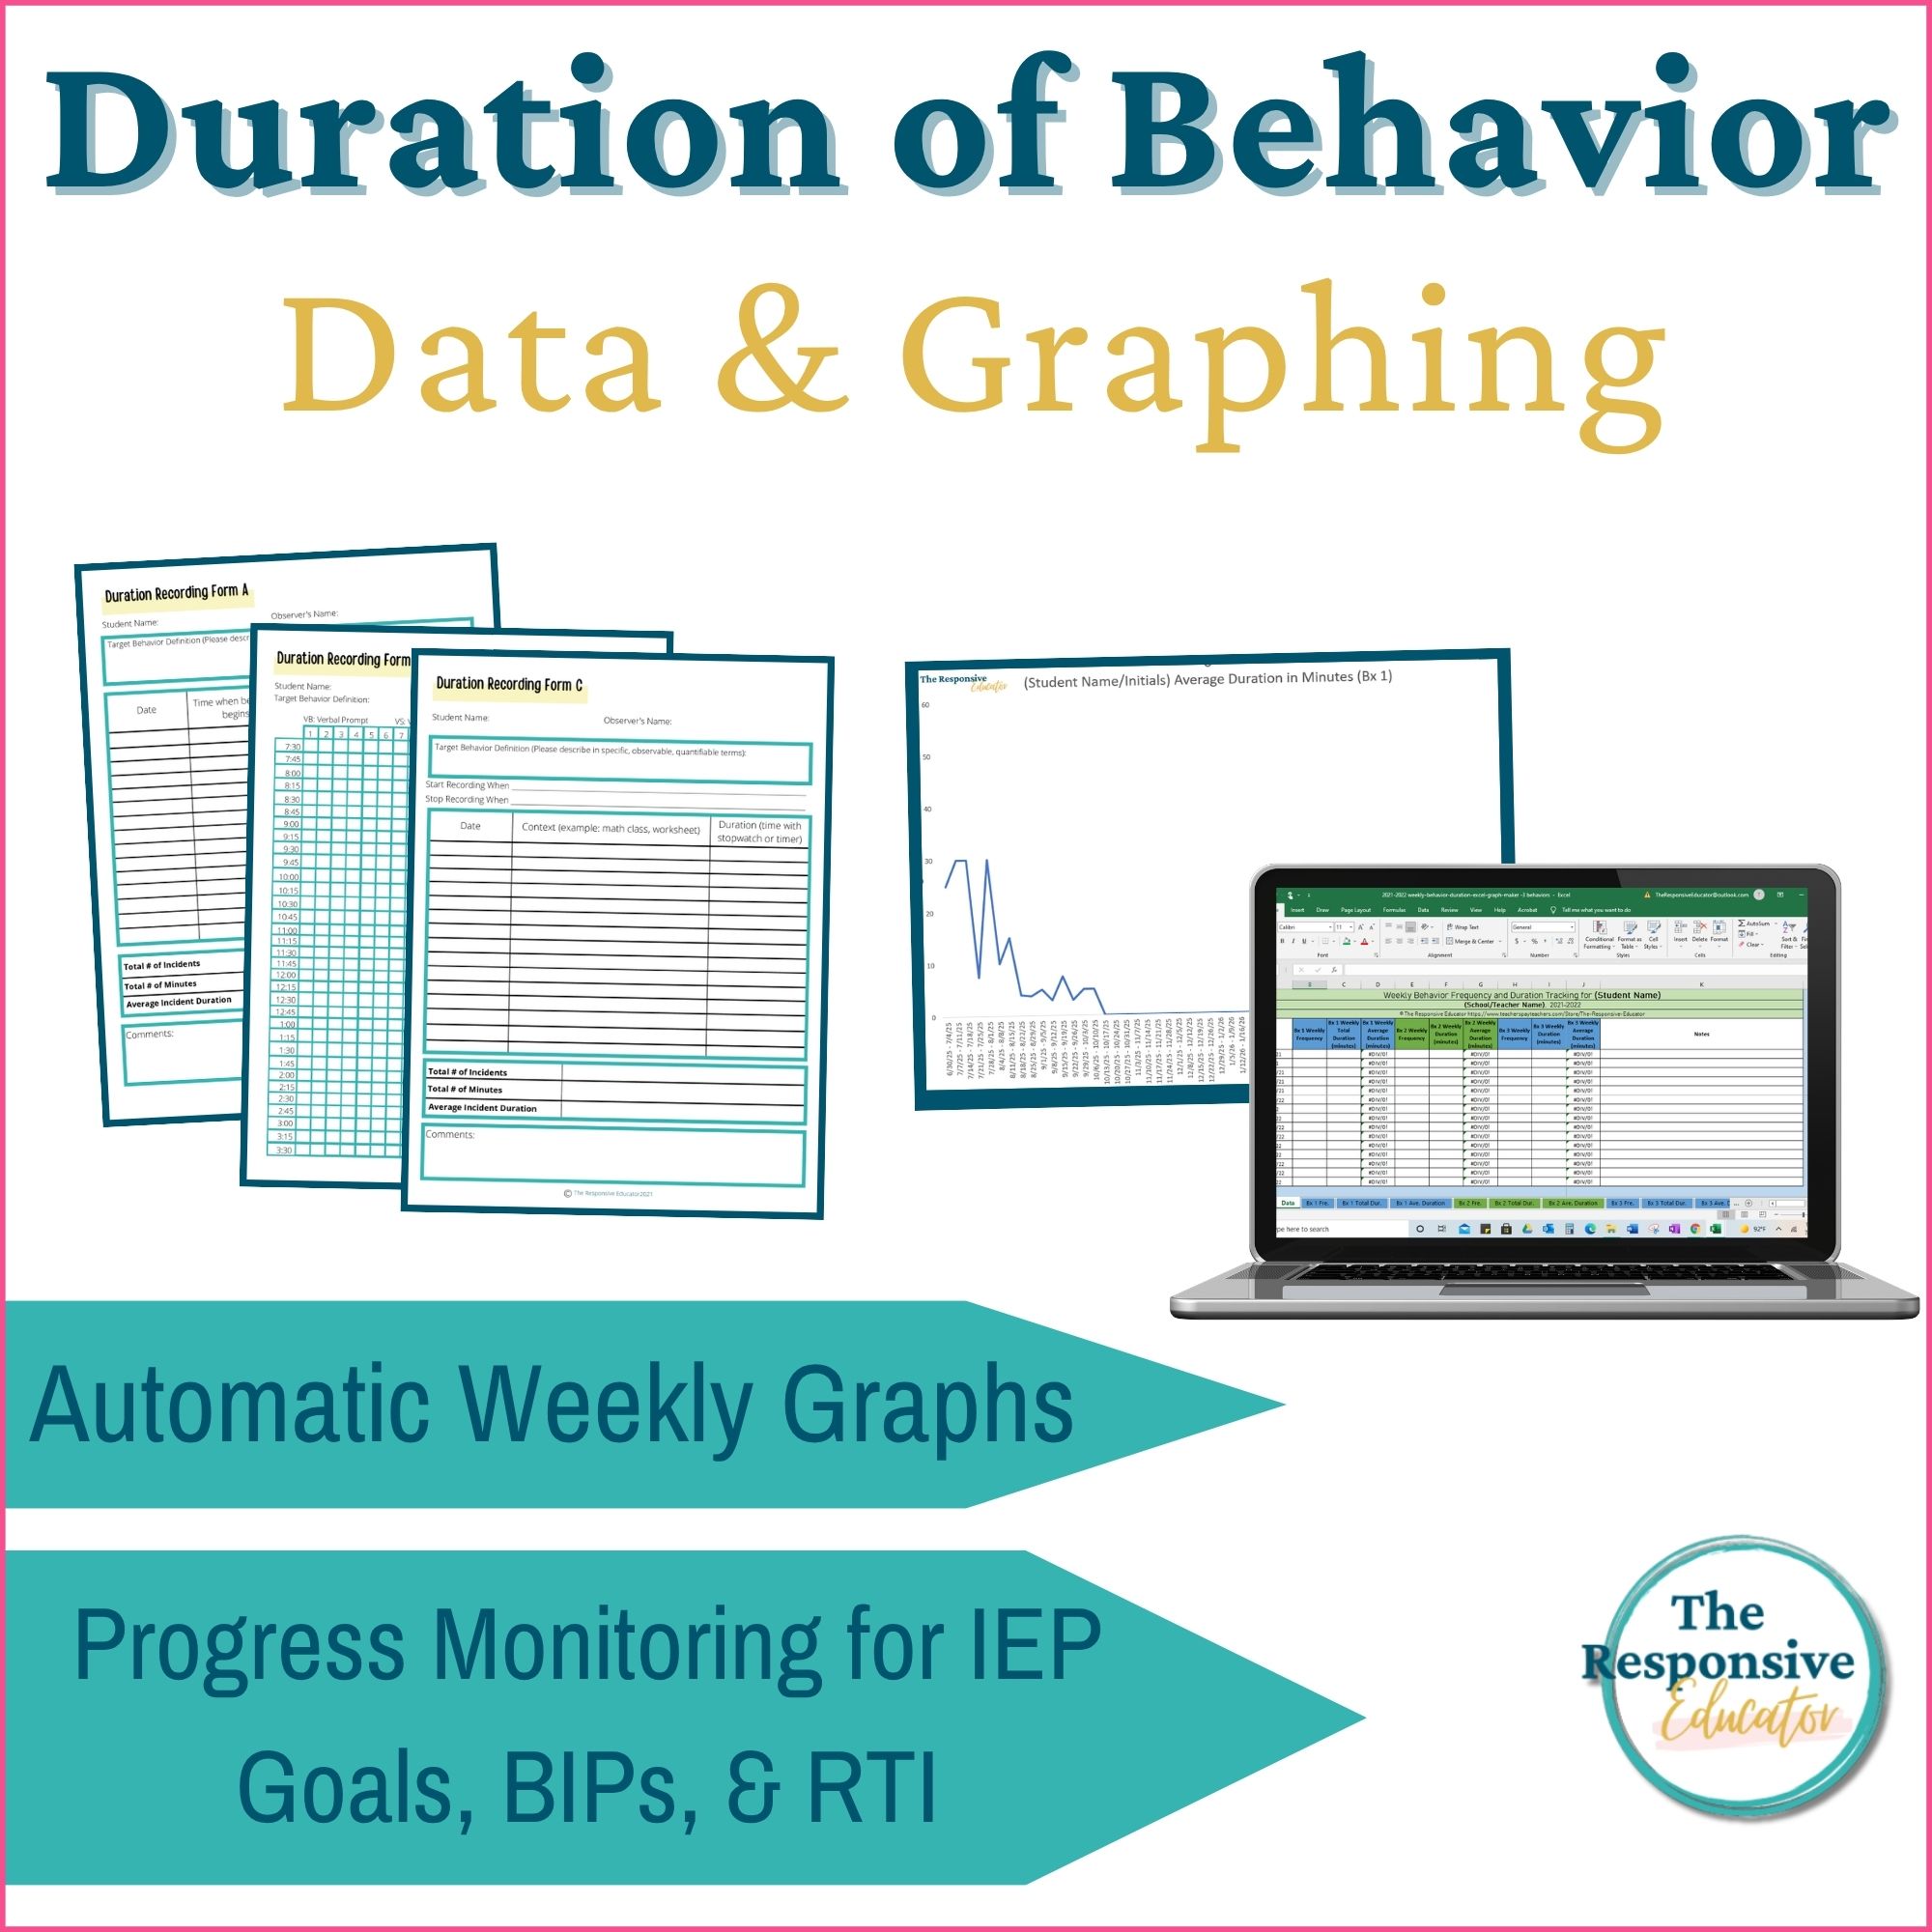
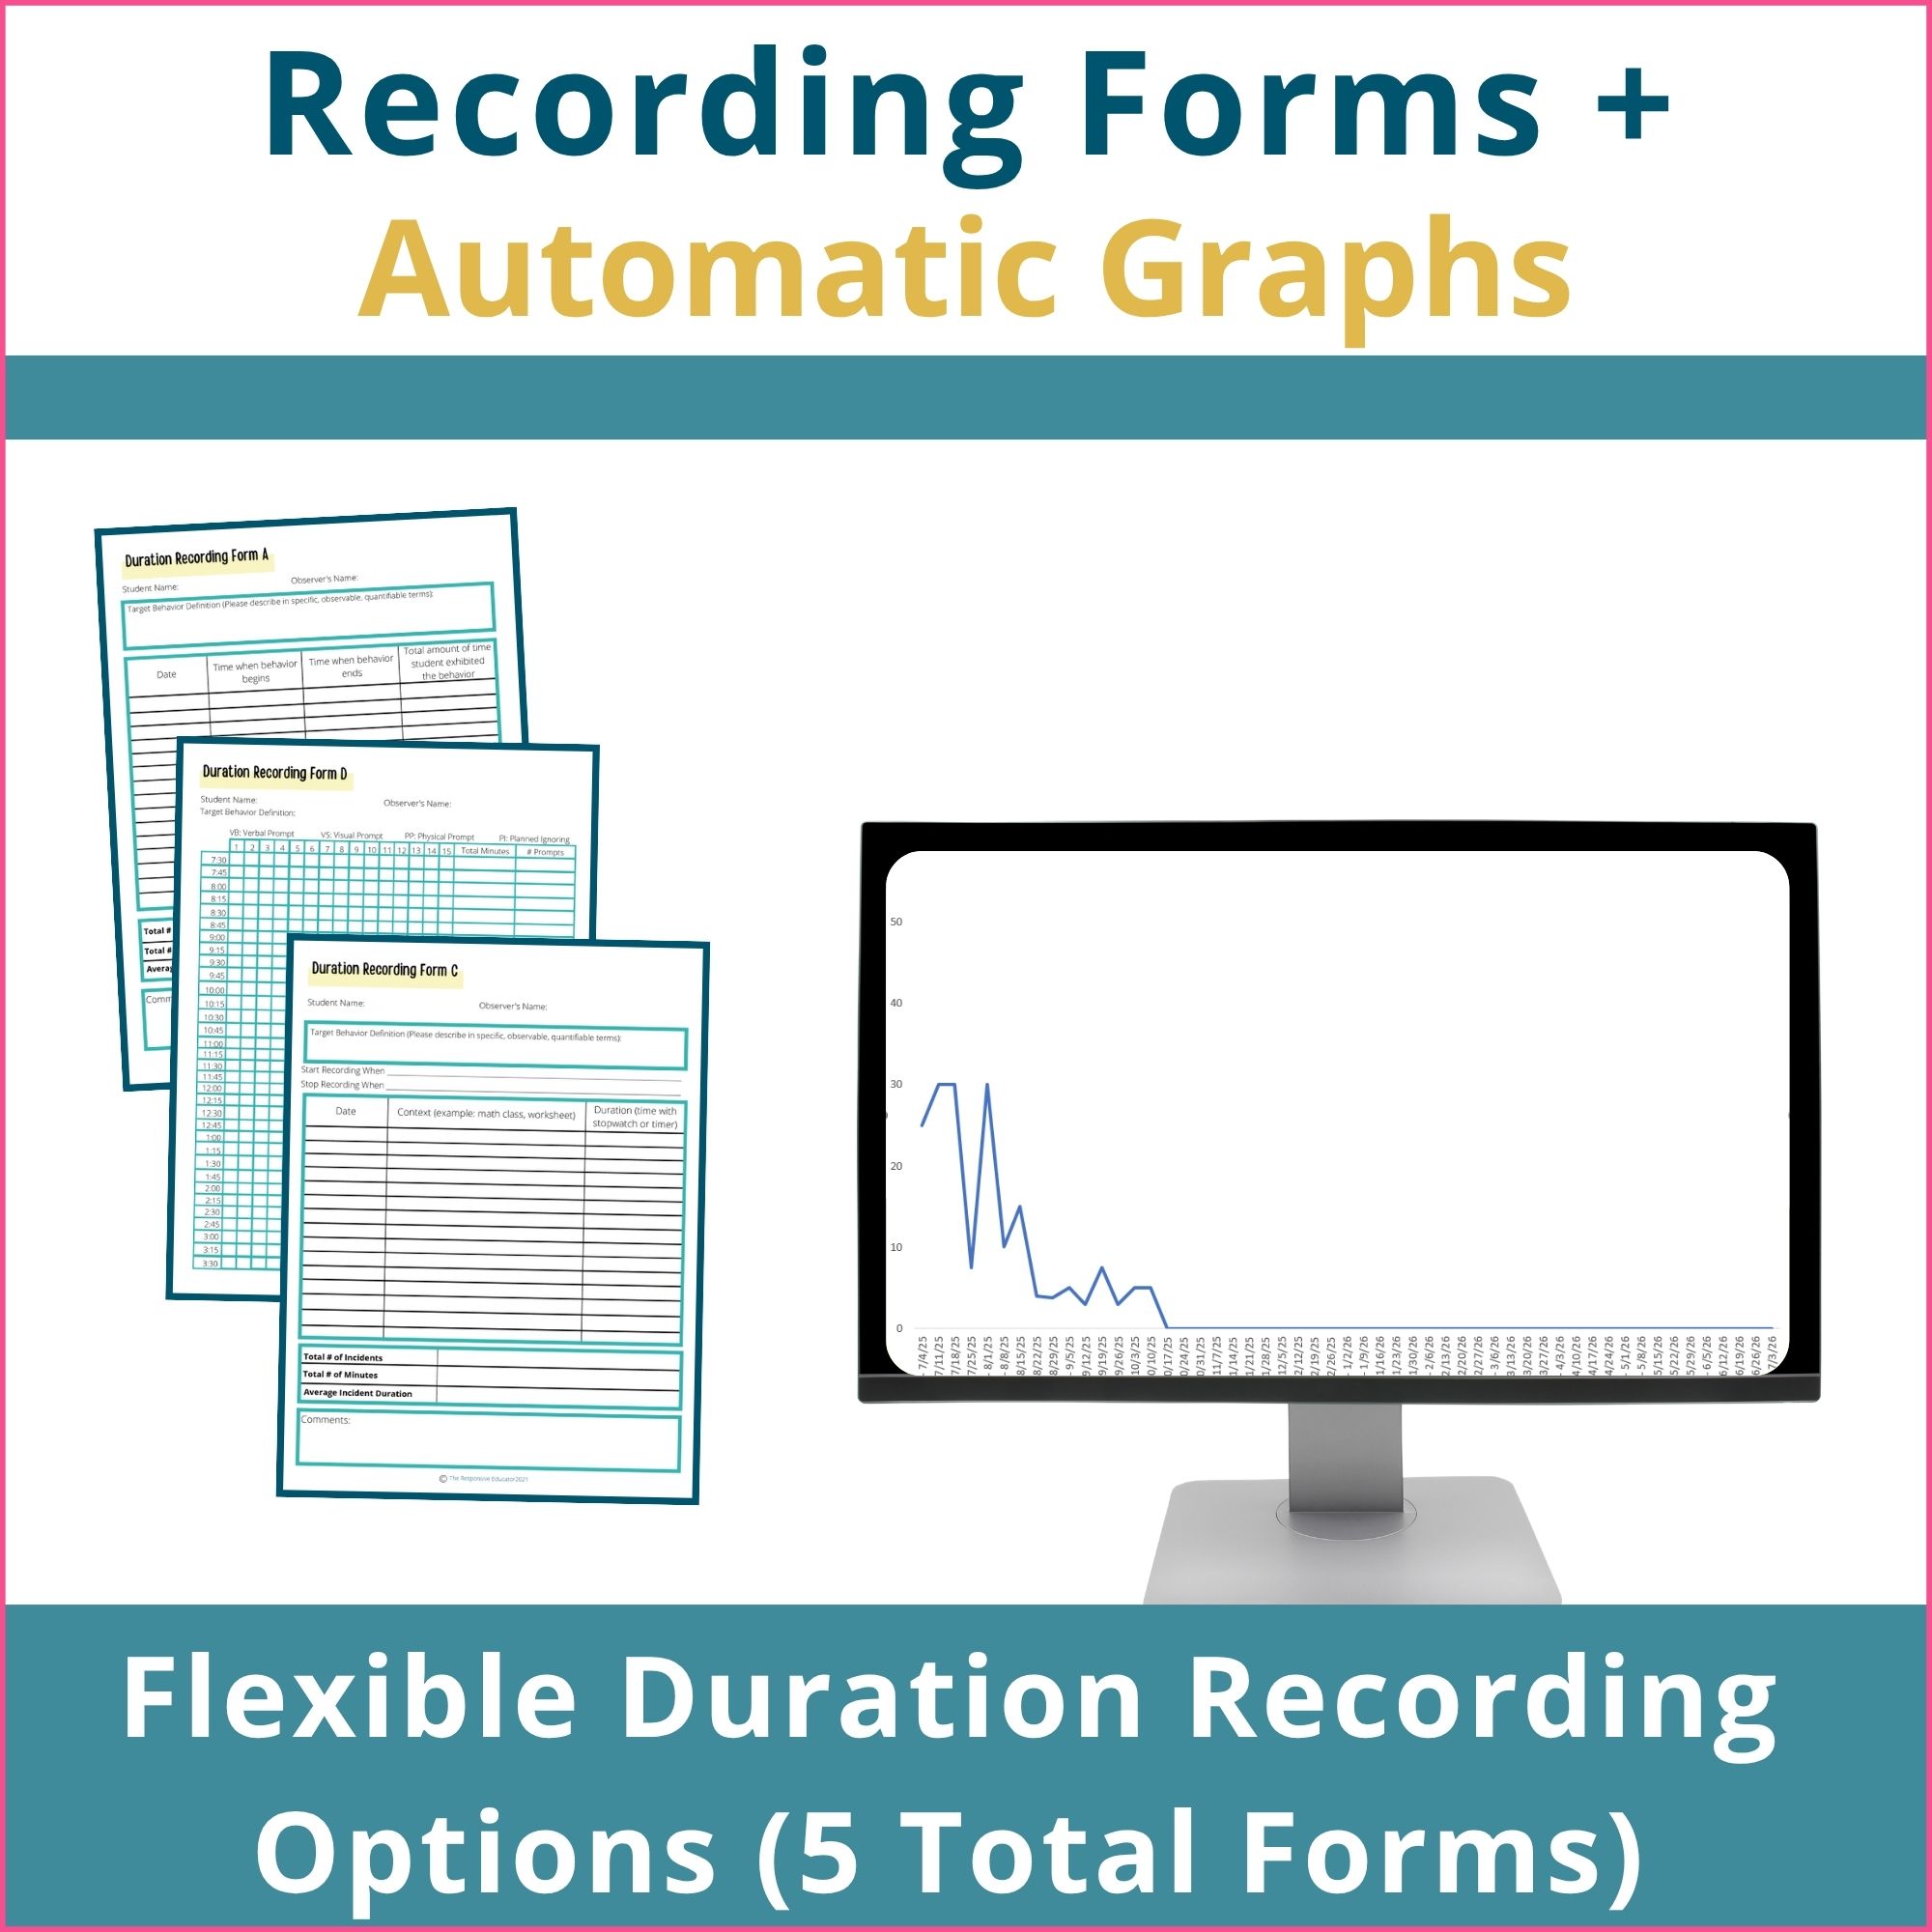
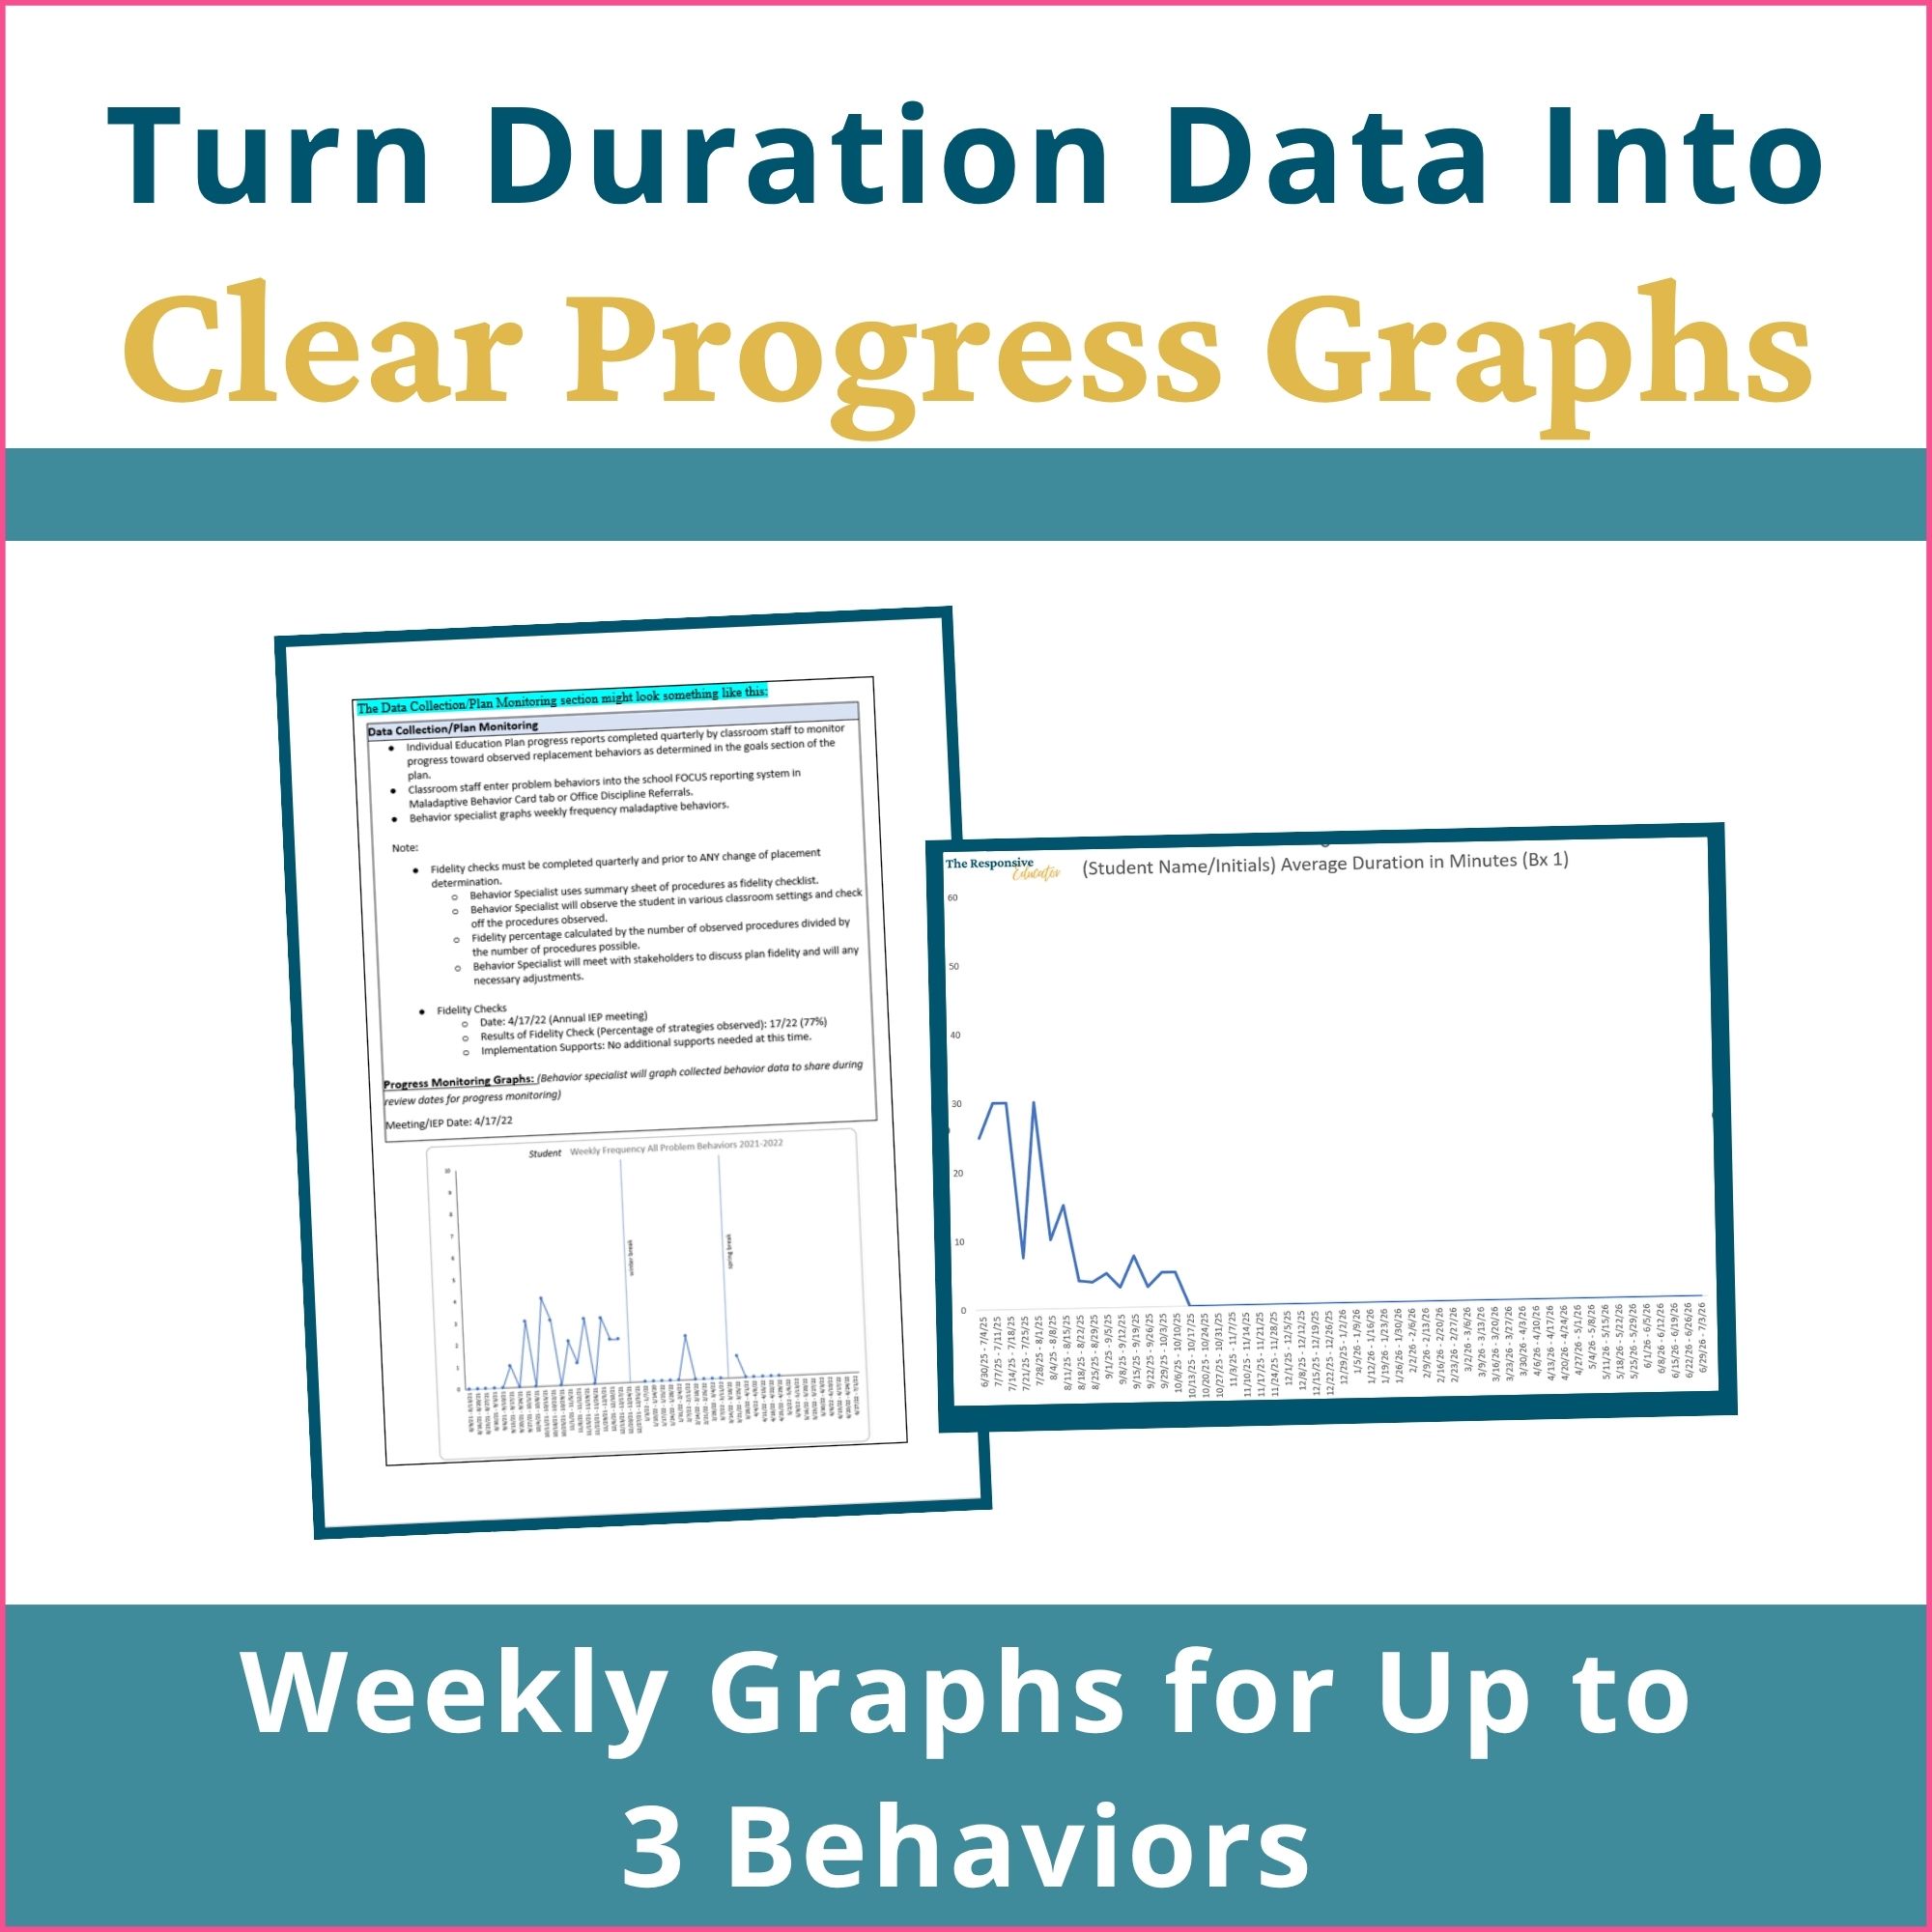
Duration Recording Data Sheets & Graphing helps you measure how long student behaviors last and review changes over time. Use the four printable recording forms to collect behavior duration data, then enter your weekly totals into the included spreadsheets to graph progress for up to three behaviors. The forms and graphs support progress monitoring, intervention planning, and communication with your student’s support team.
When to Use Duration Recording
Duration recording measures the amount of time a behavior lasts, from its beginning to its end. It is useful when reducing the length of a behavior is a goal or when frequency counts alone don’t capture the change you need to monitor.
For example, a behavior that decreases from 30 minutes to 5 minutes shows a meaningful reduction in duration, even if it still occurs daily. A duration data sheet helps you document that change.
Use this resource when you need to:
- Record how long a clearly defined behavior lasts
- Monitor changes in behavior duration over time
- Compare progress before and after an intervention change
- Share behavior data during team meetings or progress reviews
What’s Included
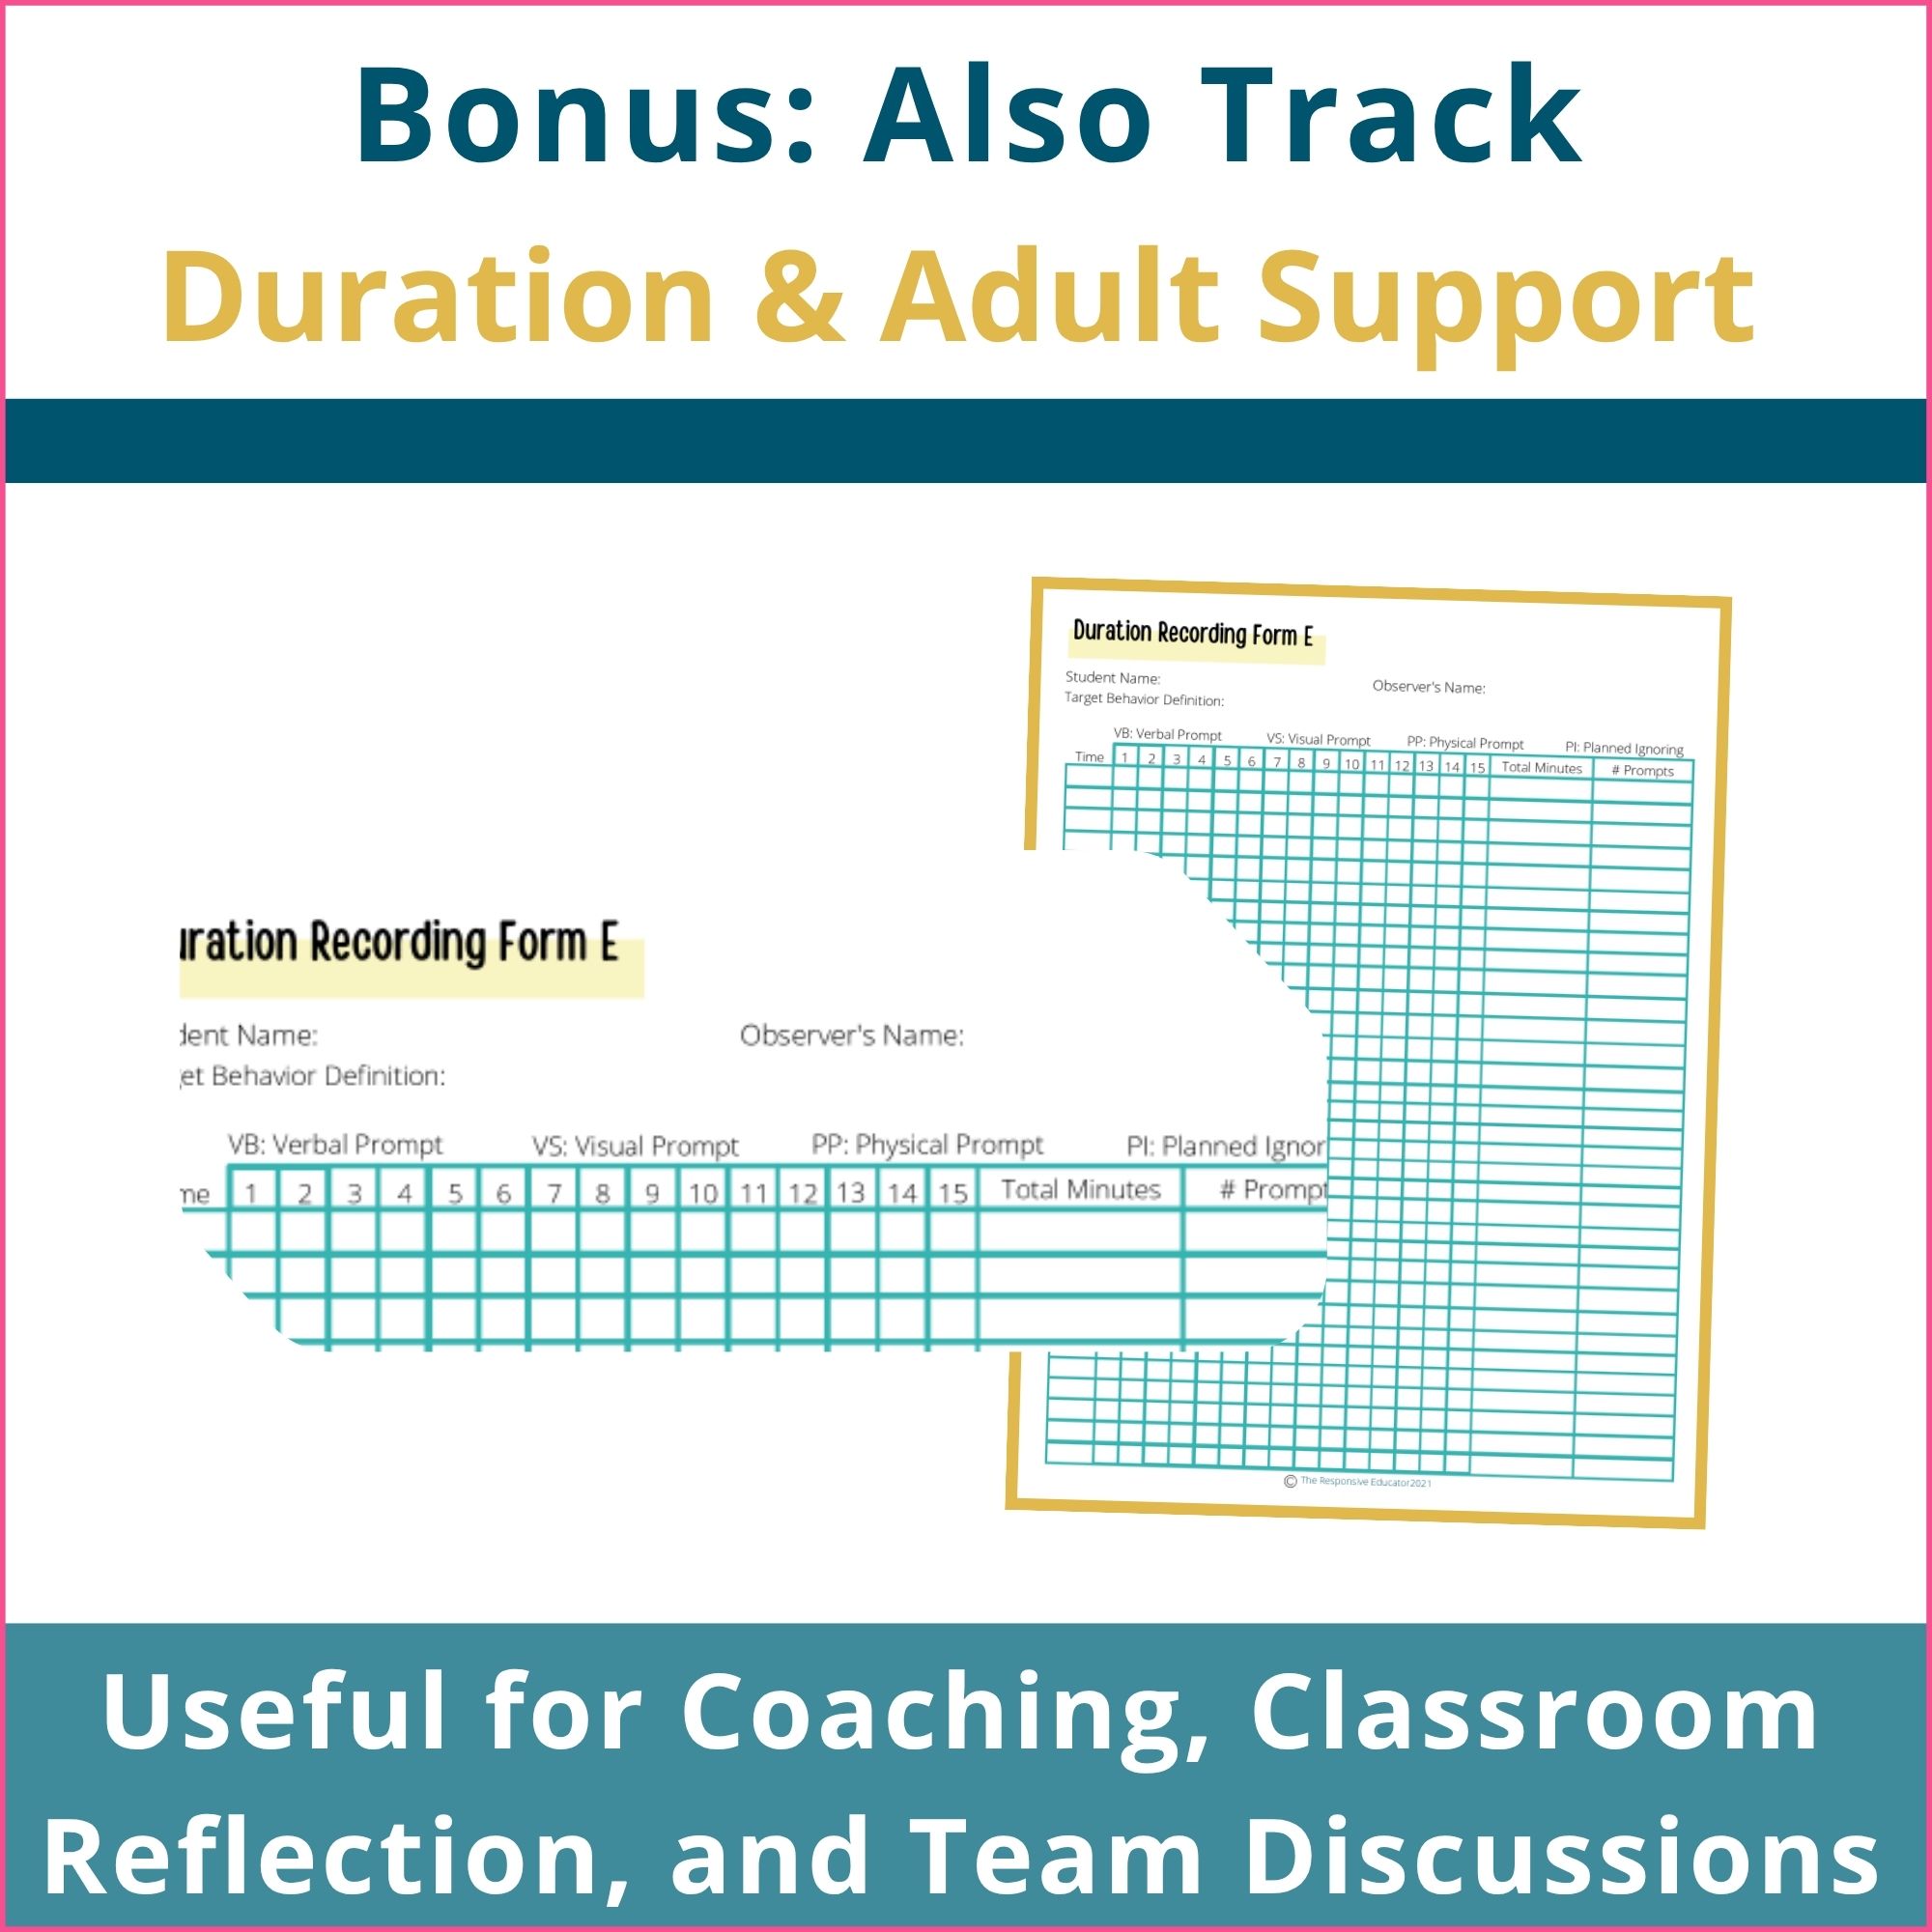
- 4 Printable Duration Recording Data Sheets: Collect duration data for behaviors that last minutes or longer.
- Weekly Behavior Duration Graphing Spreadsheets: Enter data and graph progress for up to three behaviors. Includes spreadsheets through the 2029–2030 school year.
- Overview of Common Behavior Data Collection Methods: Review when duration recording is an appropriate choice.
- Quick Excel Tips: Follow guidance for entering data and using the graphing tools.
- Example Behavior Graph: See an example with a trend line and phase line.
- Instructions for Adding Phase Lines in Excel: Mark changes that may help explain patterns in your data.
How to Use the Duration Data Sheets and Graphs
- Define the behavior you are tracking, including when it begins and ends.
- Use a duration recording sheet to record how long the behavior lasts.
- At the end of each week, enter the total number of incidents and total minutes into the spreadsheet.
- Use the spreadsheet’s automatic graphs to review progress for up to three behaviors.
- Review the data with your student’s support team to guide next steps.
Using consistent definitions and recording procedures helps make your data more useful when comparing progress over time.
Document Changes with Phase Lines
A phase line marks when a change occurred so you can consider it alongside the behavior data. Examples include starting a new intervention, changing a classroom routine, or making a significant adjustment to the learning environment.
Instructions for adding phase lines in Excel are included.
Compatibility note: The graphing spreadsheets can be used in Excel and Google Sheets. The included phase-line instructions are for Excel; that feature is not supported in the Google Sheets version of this resource.
File Format and Access
- Digital download available immediately after purchase
- Printable PDF duration recording forms
- Editable spreadsheets for data entry and graphing
- Compatible with Excel and Google Sheets, with the phase-line limitation noted above
License Information
This resource is licensed for use by one educator. Redistribution or sharing of the files is not permitted.
Use these duration recording data sheets and graphing tools to document behavior length, review patterns, and bring clearer information to your next intervention or progress-monitoring discussion.


Reviews
There are no reviews yet.