Description
Rate Recording Data Sheets & Graphing
Ten occurrences of a behavior during a 10-minute observation tell a different story than ten occurrences during an hour. When observation periods vary, total counts alone can make progress difficult to interpret. Rate recording accounts for observation time so you can compare how often a behavior occurs.
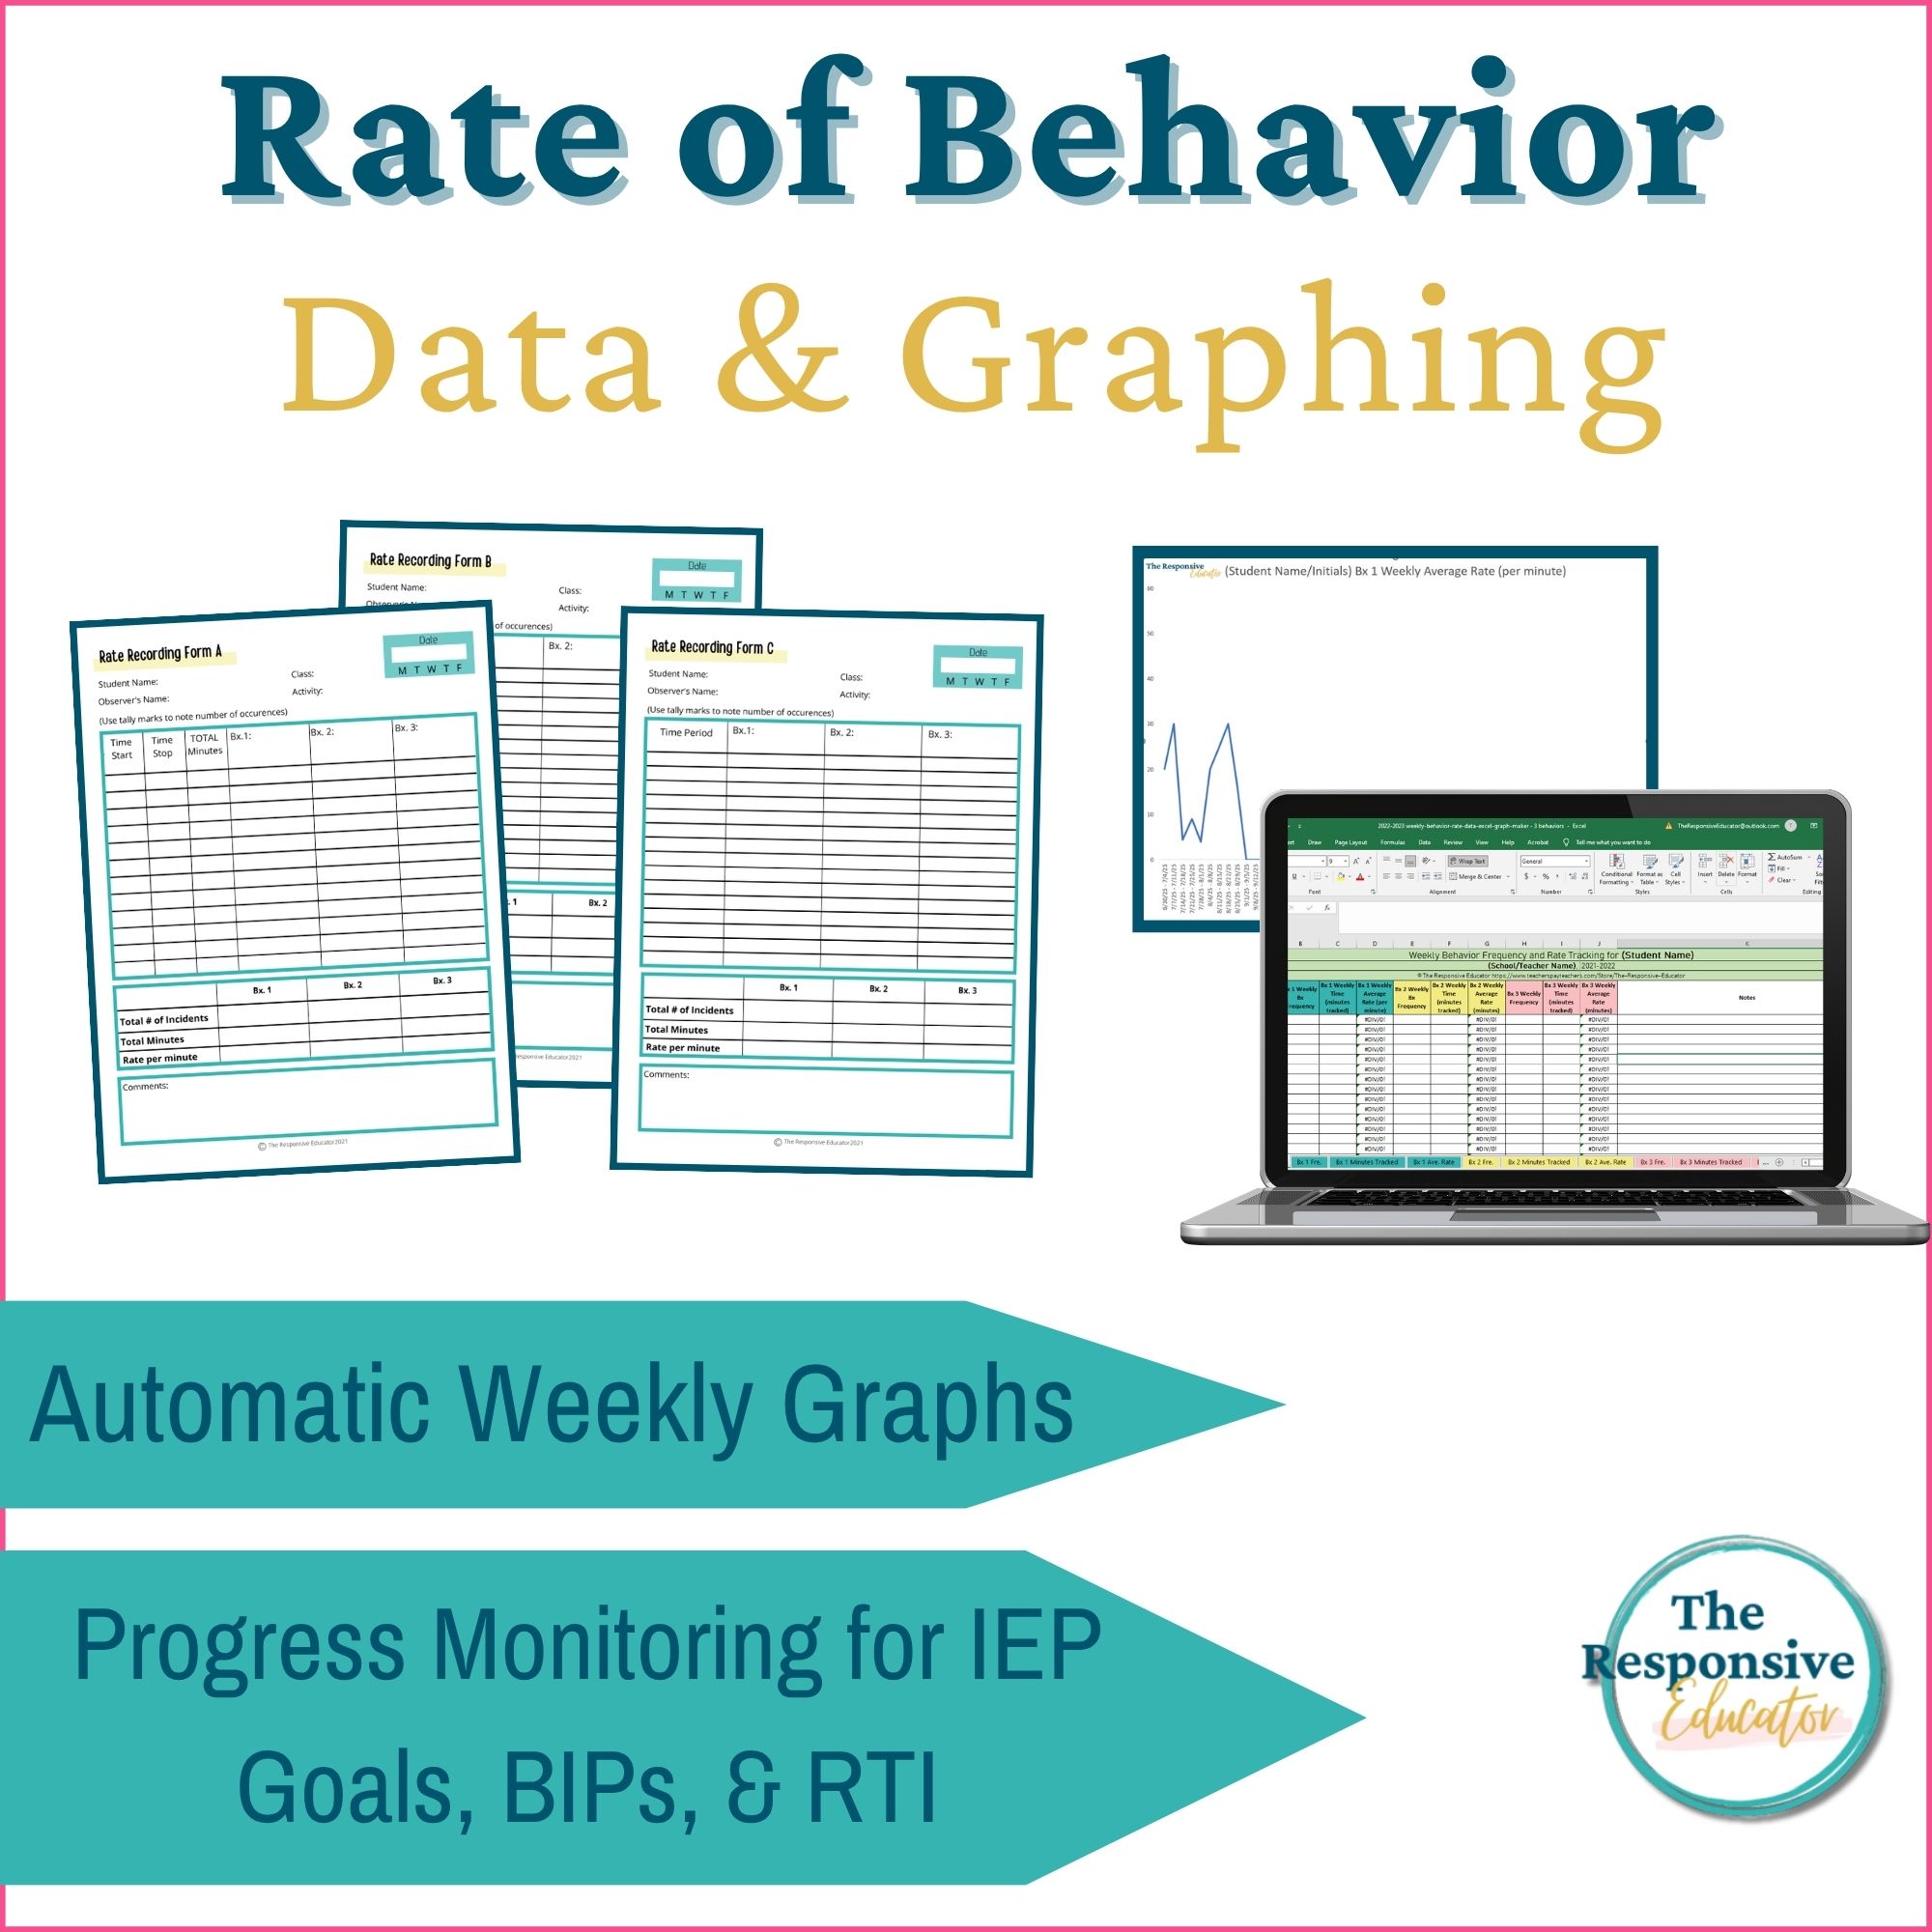
Rate Recording Data Sheets & Graphing includes three printable recording layouts and an automatic graphing spreadsheet for up to three behaviors. Record behavior counts and minutes observed, then enter those totals into the spreadsheet to calculate rate per minute and update the graphs. Use the results for IEP progress monitoring, behavior intervention reviews, and support-team discussions.
When to Use Rate Recording
Rate measures how often a behavior occurs per unit of time. It is useful when you can count individual occurrences but need to compare observations of different lengths.
For example, six occurrences in 10 minutes equals 0.6 occurrences per minute. Six occurrences in 30 minutes equals 0.2 occurrences per minute. The total count is the same, but the rate shows that the behavior happened less often relative to observation time.
Use rate data collection when you need to:
- Compare behavior across observation periods of different lengths
- Monitor countable behaviors during selected activities or routines
- Track changes in behavior rate over time
- Document progress toward IEP or BIP goals
Rate recording requires counting each occurrence during the observation period. It measures how often behavior occurs, rather than its duration or severity.
What’s Included
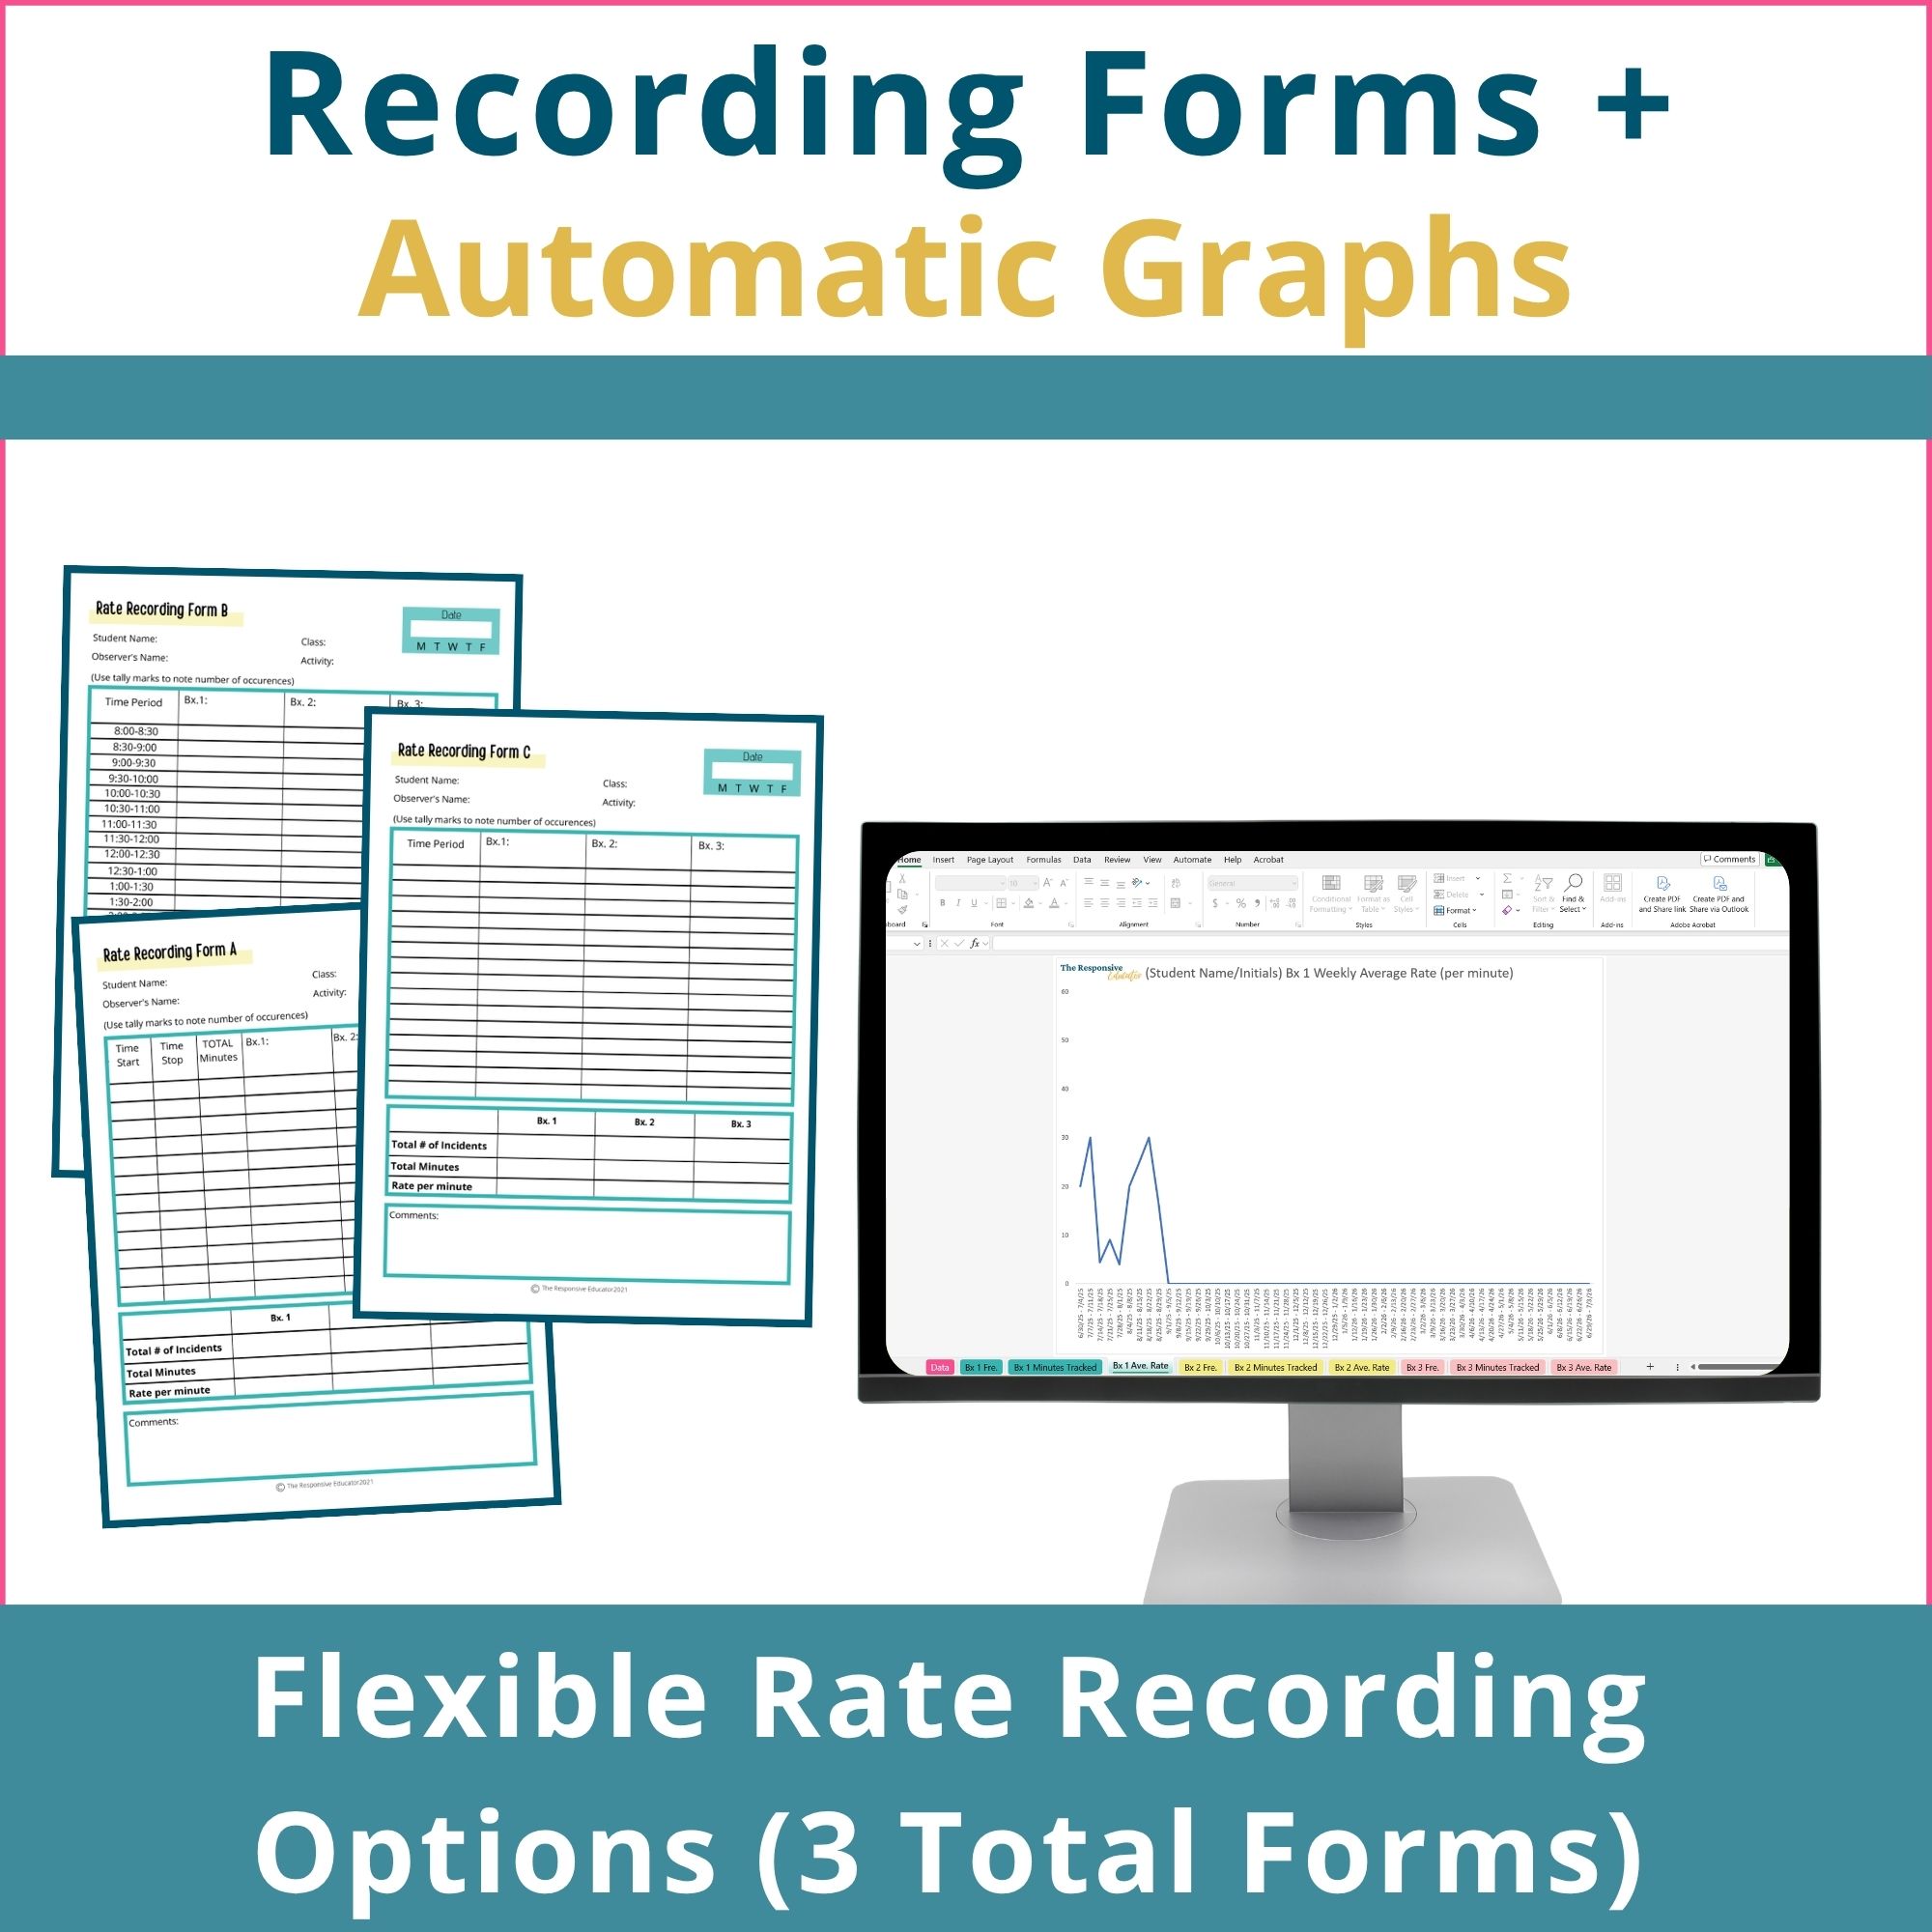
- 3 Rate Recording Forms: Different layouts for flexible observation times, fixed time blocks, and custom activity blocks. Track up to three behaviors per form.
- Color and Black-and-White Forms: Printable options for classroom use.
- Automatic Graphing Spreadsheet: Enter behavior counts and minutes observed to calculate rate per minute for up to three behaviors.
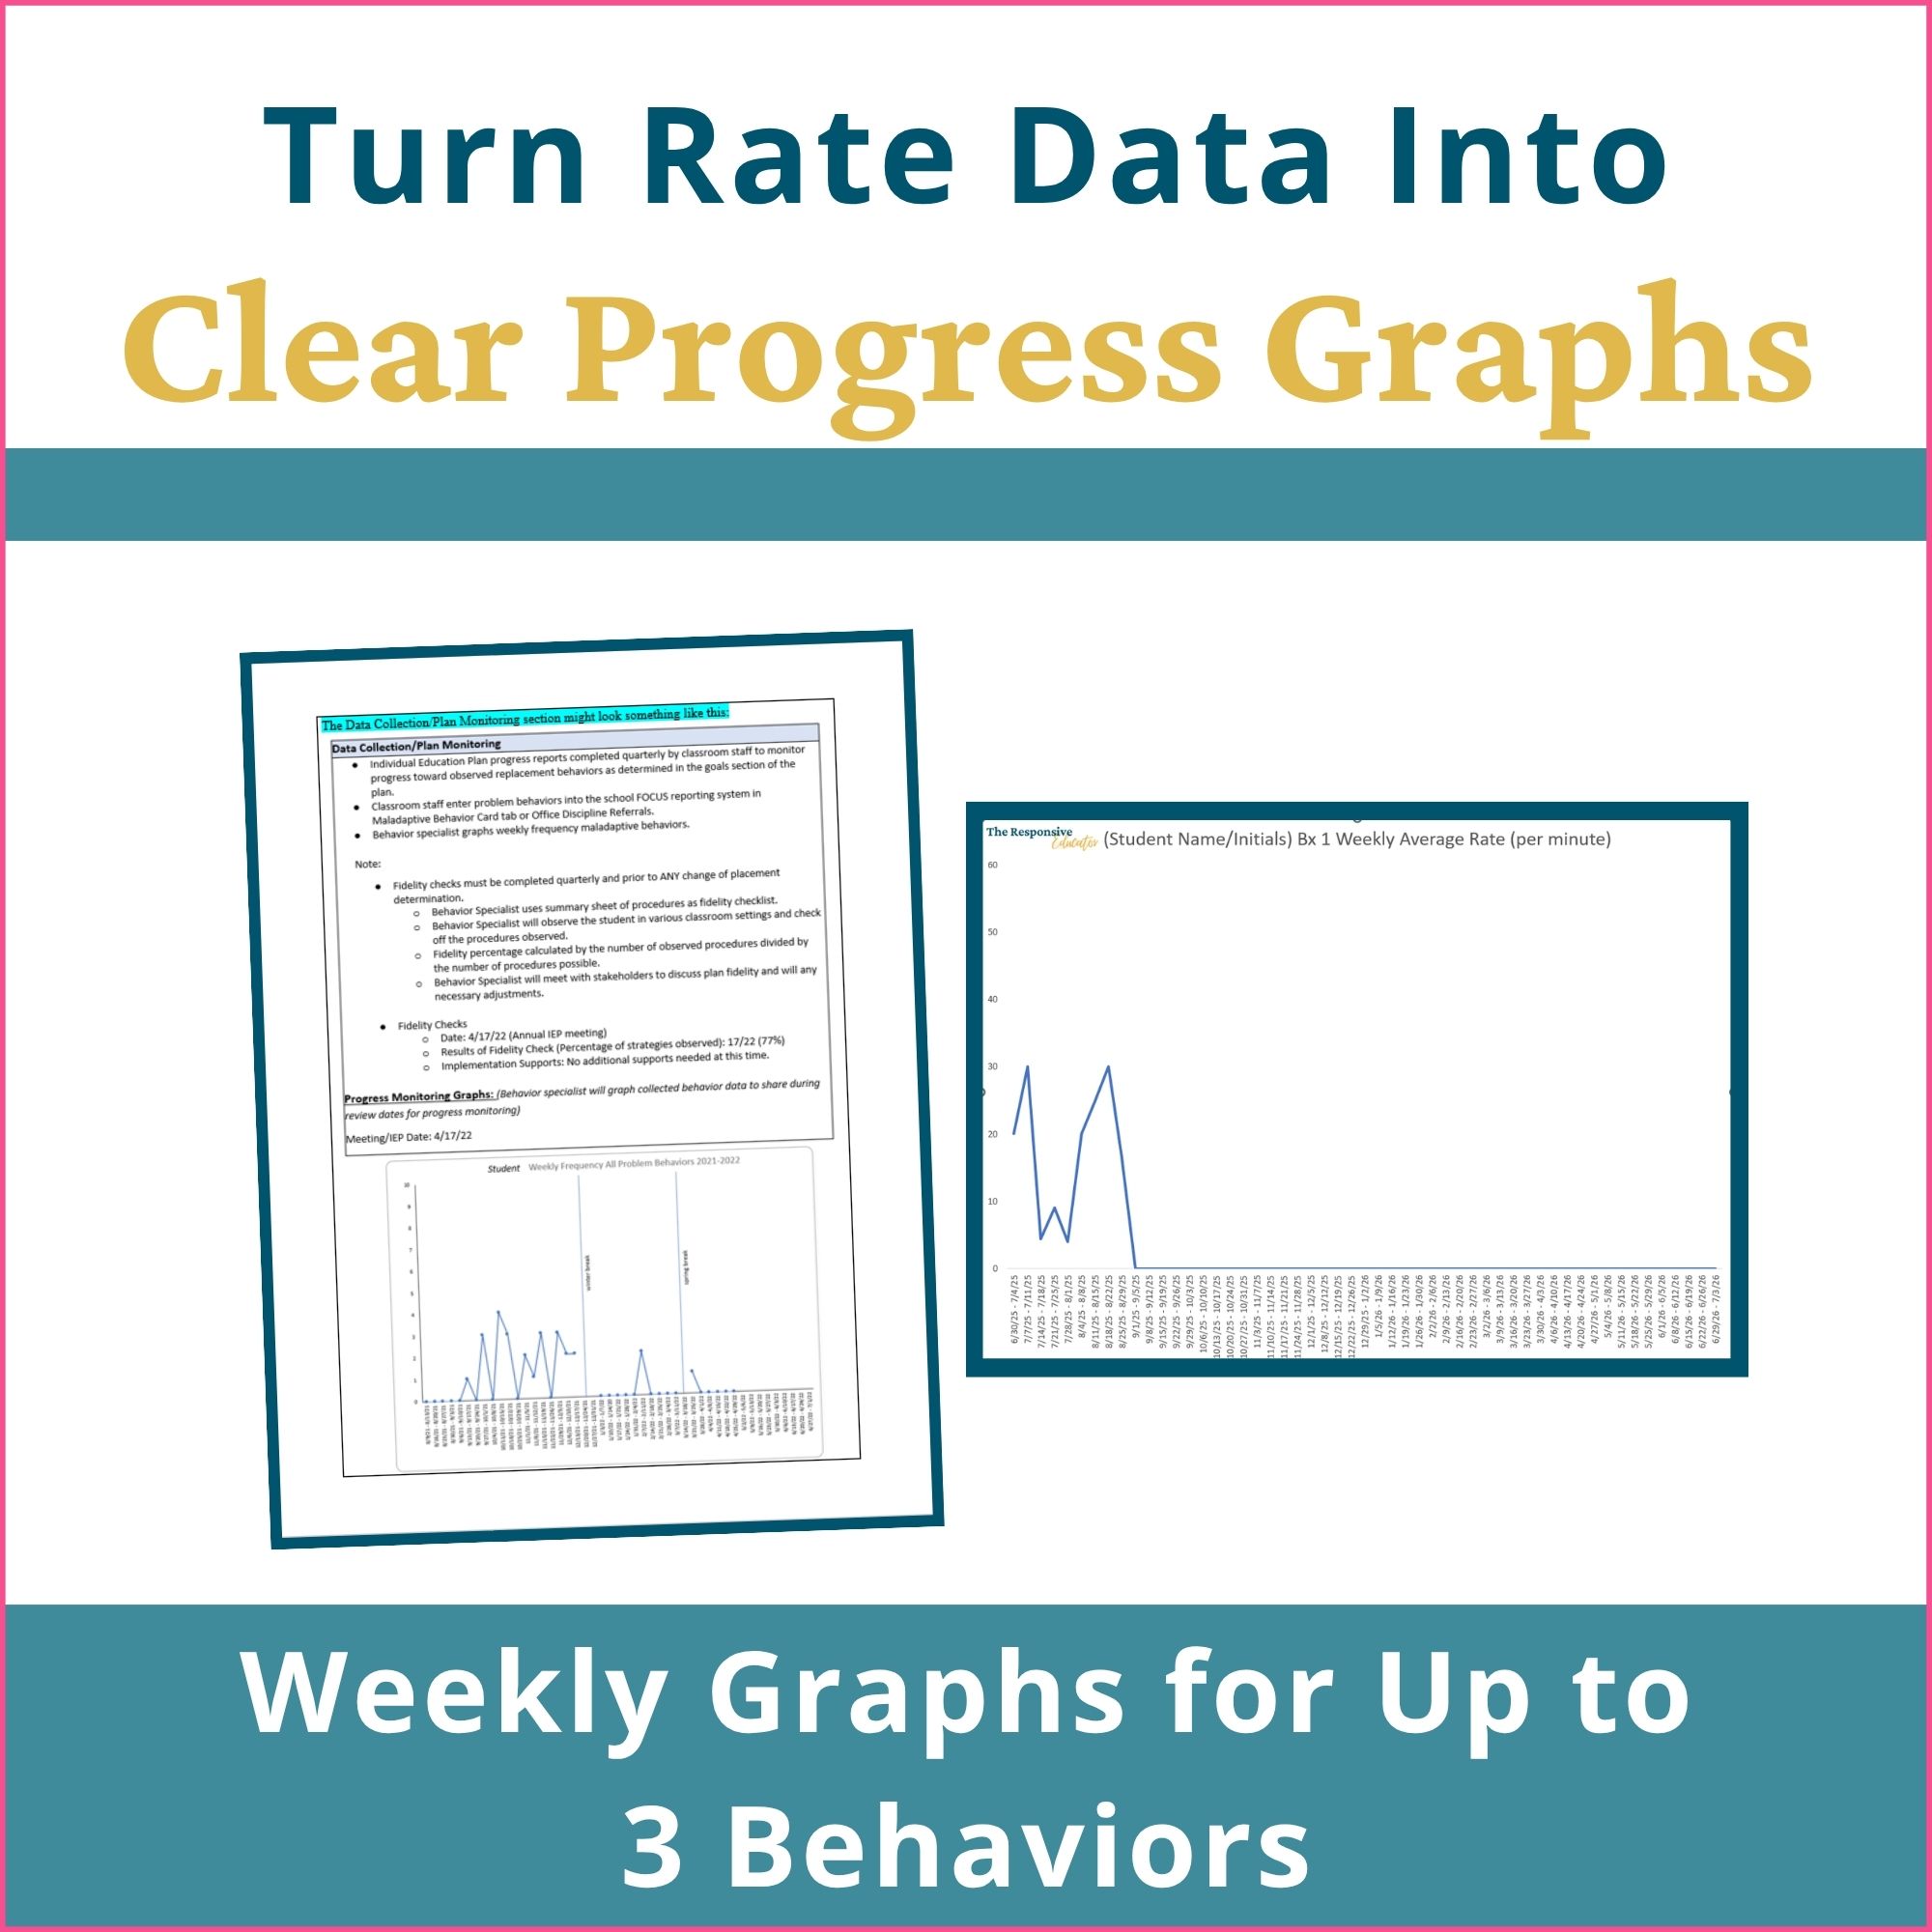
- Weekly Graphs: Review behavior frequency, minutes observed, and rate per minute. Includes spreadsheets through the 2029–2030 school year.
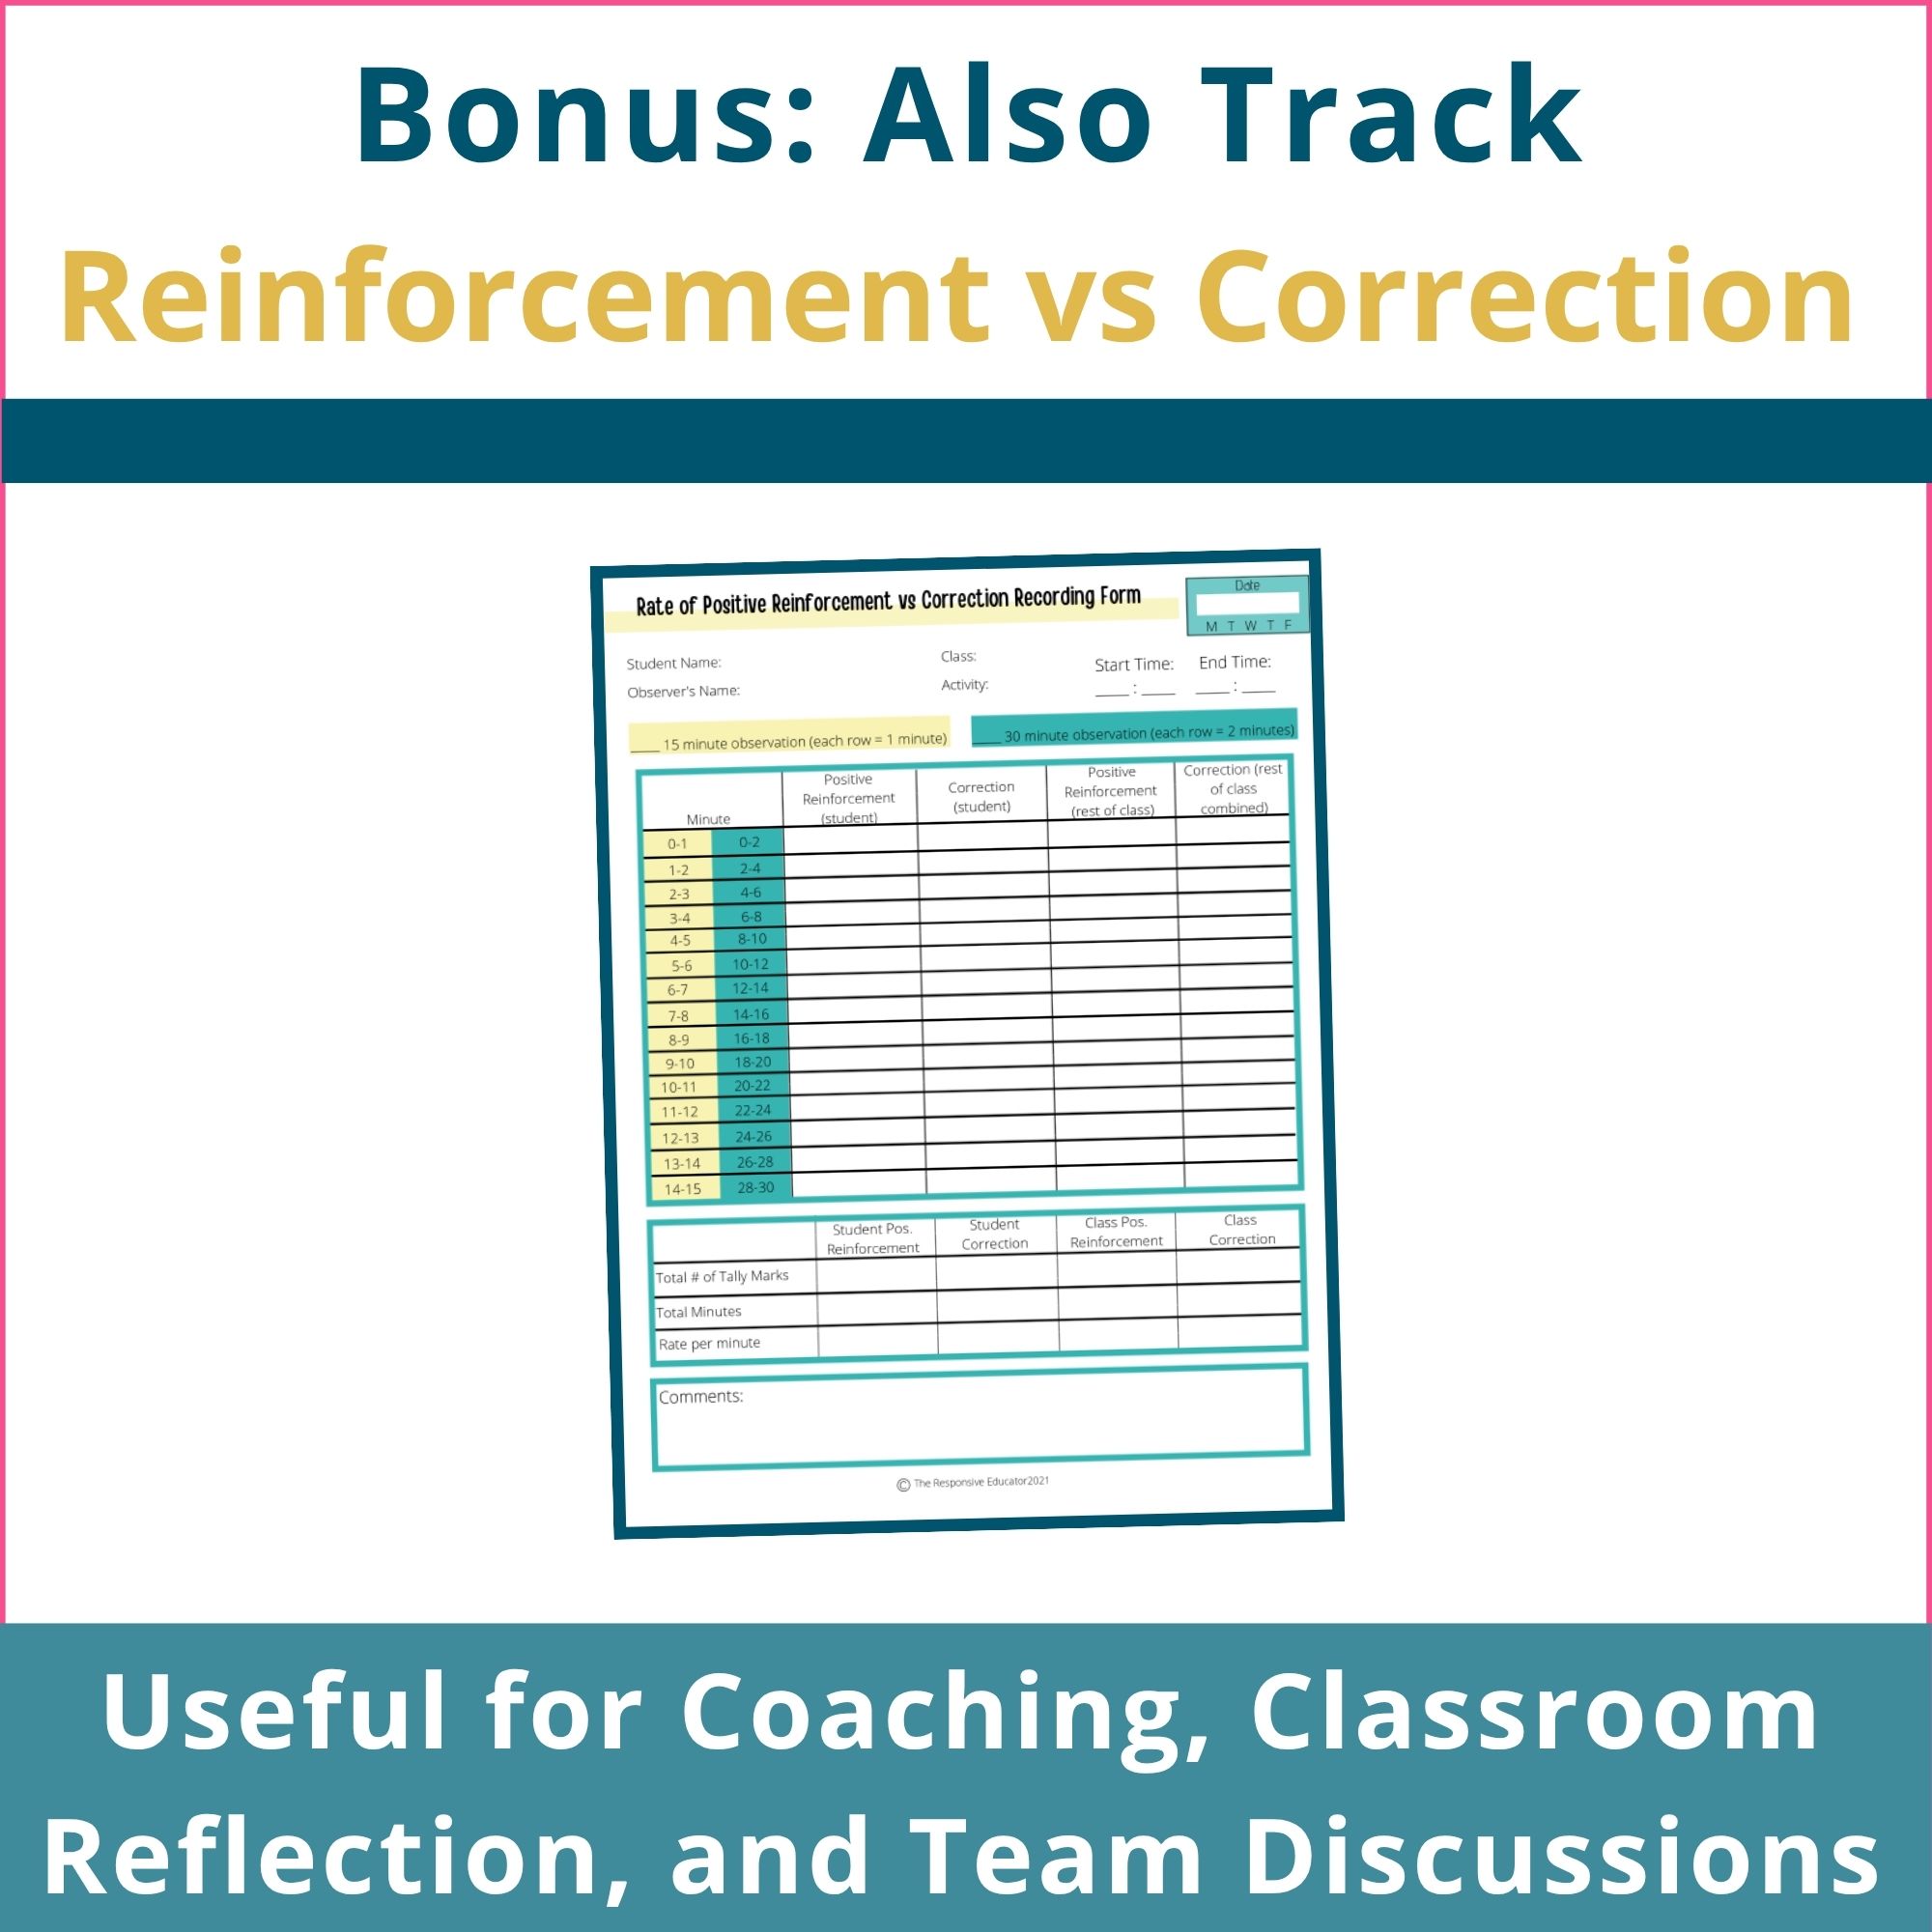
- Reinforcement vs. Correction Rate Forms: Includes 15-minute and 30-minute observation options for reviewing adult feedback patterns.
- Data Collection Method Overview: Review common behavior data collection methods and when to use them.
- Quick Excel Tips: Follow guidance for entering data and using the spreadsheet.
- Example Behavior Graph: View an example with trend and phase lines.
- Phase-Line Instructions: Learn how to mark intervention changes in Excel.
How to Use the Rate Recording Data Sheets
- Define the behavior you will count, including what counts as one occurrence.
- Choose the recording form that fits your observation schedule.
- Count each occurrence during the observation period and record the total minutes observed.
- Enter the behavior counts and observation minutes into the spreadsheet.
- Review the calculated rate per minute and automatically updated graphs.
- Use the data with your student’s support team to discuss progress and next steps.
Keep the behavior definition consistent and consider differences in activities or settings when comparing results. Accounting for observation time makes comparisons more useful, but the context still matters.
Review Adult Reinforcement and Correction Patterns
The included reinforcement-versus-correction forms help you examine how often adults provide positive reinforcement and corrections during timed observations. Record feedback directed toward a target student and the whole class using the 15-minute or 30-minute options.
This tool supports teacher reflection and instructional coaching. Reviewing adult feedback alongside student behavior data can help your team identify adjustments to classroom supports.
Use Graphs for Progress Monitoring
The graphs update as you enter data, so you don’t need to build new charts for each progress report. Review whether behavior rates are increasing, decreasing, or remaining stable, and share those patterns with families and support staff.
Phase lines mark when a change occurred, such as introducing an intervention or adjusting a classroom routine. They help your team consider those changes alongside the student’s progress.
File Format and Compatibility
- Digital download available immediately after purchase
- Printable PDF rate recording forms
- Editable spreadsheets for data entry, rate calculations, and automatic graphing
- Works in Excel and Google Sheets
Phase-line note: The included phase-line instructions are for Excel. The phase-line feature is not supported in the Google Sheets version of this resource.
License Information
This resource is licensed for use by one educator. Redistribution or sharing of the files is not permitted.
Use these rate recording data sheets and graphing tools to compare behavior across observation periods, document progress, and bring clearer information to your next team discussion.


Reviews
There are no reviews yet.