Imagine two teachers observe the same student during math instruction. The first teacher watches for 20 minutes and records 10 call-outs. The second teacher watches for 40 minutes and records 15 call-outs. At first glance, the second observation looks worse because the student called out more times.
Once you account for the length of each observation, however, the story changes. During the first observation, the student averaged 0.5 call-outs per minute. During the second, the student averaged approximately 0.38 call-outs per minute. Even though the second observation included more total call-outs, the behavior occurred at a lower rate.
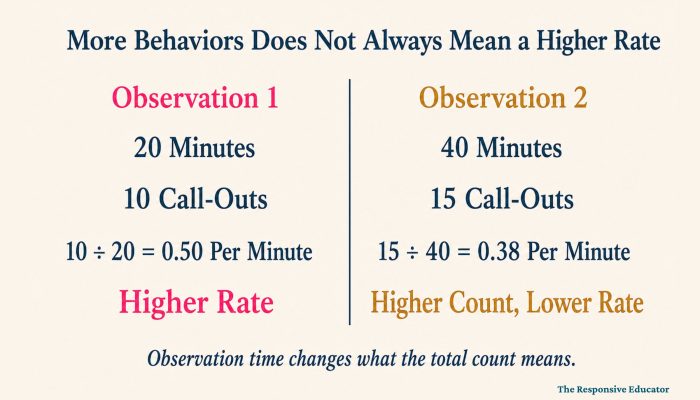
That is why rate count can be so useful. Frequency count tells you how many times a behavior occurred. Rate count tells you how often it occurred relative to a specific amount of time. When observation periods are different lengths, that additional information allows you to compare the data more fairly.
I often compare it to describing a car trip. If I tell you that I drove 60 miles, you know the distance I traveled. If I also tell you that the trip took one hour, you understand the drive very differently than you would if it took four hours. The distance did not change, but adding time changed what the number meant.
Behavior data works the same way. The count matters, but sometimes the time connected to that count is what gives it meaning.
This article assumes you have already decided that rate count may be the right behavior measurement method. If you are still choosing between frequency, rate, duration, interval, or another method, begin with Behavior Data Collection: How to Choose the Right Measurement Method.
Because rate count begins with counting each occurrence, you may also want to read Frequency Count: When Is It the Right Choice?
Rate count measures how often a behavior occurs within a specific amount of time. You begin by counting each occurrence of the behavior, just as you would with frequency count. You then divide that total by the amount of time observed.
Rate = Number of occurrences ÷ Observation time
For example:
Rate count is especially helpful when students arrive late, leave early, attend shortened school days, or are observed by different staff members for different lengths of time. Instead of comparing totals that only appear equivalent, you are comparing how often the behavior occurred within the same unit of time.
You may see frequency and rate defined somewhat differently across schools and ABA resources. Some professionals use frequency to refer to a raw count, while others use it to mean responses per unit of time. In this series, I use frequency count for the raw number of occurrences and rate count for the number of occurrences divided by time. Whatever terminology your team uses, write the unit clearly so everyone knows whether the number represents a total, a rate per minute, or a rate across another period.
Most of the time, frequency count works perfectly well. If you observe a student for the same amount of time under similar conditions each day, simply counting how many times the behavior occurs may answer your question. There is no reason to add another calculation when it will not make the data more useful.
Rate count becomes valuable when observation times are inconsistent. Imagine that you collect data during reading instruction. On Monday, the lesson lasts 30 minutes. On Tuesday, a special assembly shortens reading to 15 minutes. Comparing the two raw totals could lead you to conclude that the student improved on Tuesday when the student may simply have had half as much time in which to engage in the behavior.
I have found rate count particularly useful when:
The goal is not to choose the most complicated calculation or the number that sounds most dramatic. It is to choose the measurement that gives the clearest and fairest picture of what is happening.
One of the first students I remember using rate count with was working on reducing his calling-out behavior during classroom lessons. We began with a simple frequency count. Each time he called out without raising his hand, I gave him a quiet signal, and he recorded a tally mark. At the end of the lesson, we had a total count.
Then we completed one additional step. We divided the total by the number of minutes in the lesson to calculate his rate of calling out. He already knew that he called out frequently, but seeing that he interrupted instruction an average of 1.8 times per minute surprised him. “A lot” had been vague. Nearly twice every minute gave him a much more concrete picture.
That calculation was not meant to embarrass him or prove that he was a problem. It helped him understand why we were working on the skill and gave him a meaningful way to monitor his own progress. As the rate decreased, he could see evidence that his efforts were making a difference.
I have found that adults sometimes need the same context. Telling a parent that a student called out 45 times during one lesson certainly communicates that the behavior occurred frequently, but it does not show what the lesson felt like. Explaining that the student interrupted instruction nearly twice every minute often creates a clearer picture of the instructional impact.
Sometimes rate count is needed to make observations comparable. Other times, it is valuable because it communicates the behavior more clearly.

Collecting rate data is not complicated, but it requires one piece of information that can easily be overlooked: the exact length of the observation. Without both the behavior count and the observation time, you cannot calculate an accurate rate.
Before collecting data, define the behavior clearly enough that everyone knows what counts as one occurrence. Then start a timer and tally each occurrence while the timer is running. I often recommend using a vibration setting so the timer does not interrupt instruction or draw students’ attention to the observation.
When the observation ends, record both the total number of occurrences and the total amount of time. Then divide the count by the observation time:
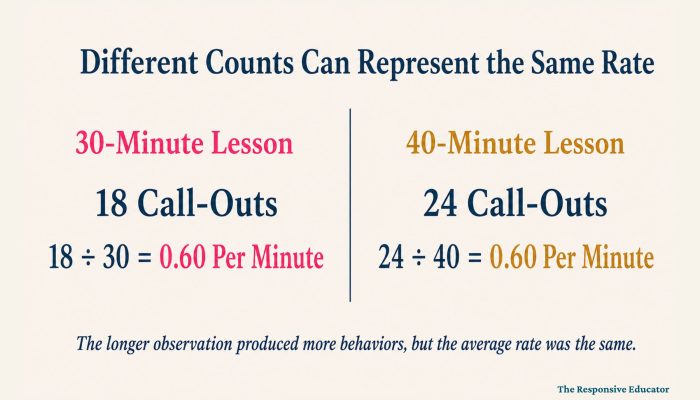
The raw totals are different, but the rate of behavior is exactly the same. Without calculating rate, someone might assume that the 40-minute observation represented worse behavior. Once time is included, it becomes clear that the student called out at the same average rate during both lessons.
One mistake I saw when supervising paraprofessionals was not a failure to tally the behavior. Staff usually remembered the tally marks. The missing piece was often the observation time. I encouraged staff to start the timer before making the first tally because, once that step became part of the routine, collecting complete rate data became much easier.
Planned observation time and actual observation time are not always the same. A 30-minute observation may be interrupted by a fire drill, a student leaving the room, or an unexpected schedule change. Record the time during which the behavior could actually be observed rather than automatically writing down the time you originally planned.
This matters because rate is only fair when both parts of the calculation are accurate. A precise count divided by an inaccurate observation time still produces misleading data.
Once you calculate the rate of a behavior, look for patterns across several observations. I rarely make a decision based on one data point. Students have good days and difficult days, routines change, and events outside the classroom can affect behavior from one observation to the next.
Start with the overall trend. Is the student’s rate of behavior gradually decreasing, increasing, or remaining relatively stable? Did the rate change after a new intervention, schedule adjustment, or classroom support was introduced? Looking across time gives you a more reliable picture than reacting to one unusually good or difficult observation.
Then consider what the number means in the classroom. A student who averages one call-out every five minutes presents a different instructional concern from a student who averages nearly two call-outs per minute. A student who elopes once every few days requires a different level of support from a student who averages three or four elopements per day.
The purpose of rate data is not simply to calculate another number. It is to understand how frequently a clearly defined behavior occurs relative to time. That context helps you compare observations fairly, explain the instructional impact, and evaluate whether an intervention is producing meaningful change.
Rate count tells you how often a behavior occurs within a unit of time. It does not tell you what triggers the behavior, what the student gains or avoids afterward, or which unmet skill may be contributing to the pattern.
If the rate is much higher during one subject, with one task, or in one setting, that difference gives you an important question to investigate. Classroom observations and ABC data collection can help you examine what happens before and after the behavior. The rate identifies the pattern; the surrounding data helps you understand what that pattern may mean.
Like every behavior measurement method, rate count is only useful when the data is collected consistently. Most problems are preventable once everyone understands exactly what must be counted, timed, and recorded.
Teachers sometimes collect everything needed to calculate rate and then compare the raw frequency totals anyway. If one observation lasted 20 minutes and another lasted 45 minutes, the totals alone do not tell you whether the student’s behavior actually changed. Convert both observations to the same rate before comparing them.
Rate count requires two pieces of information: the number of occurrences and the amount of time observed. If either is missing, the rate cannot be calculated accurately. Decide how the observation will be timed before data collection begins, and make starting the timer part of the routine.
If you begin calculating behaviors per minute, continue using that unit throughout the set of data you plan to compare. Switching from behaviors per minute one week to behaviors per hour the next makes the pattern harder to interpret unless all of the previous data is converted to the new unit.
You can absolutely describe the result differently when speaking with a student, family, or IEP team. Saying that a student averages 1.8 call-outs per minute and saying that the student interrupts instruction almost twice every minute communicate the same data. You are changing the explanation, not the measurement.
Rate is useful, but it is not automatically better than frequency. If every observation lasts 30 minutes and occurs under comparable conditions, frequency count may answer the question just as well. The goal is not to make data collection more complicated; it is to select the simplest method that still produces an accurate picture.
Rate corrects for differences in time, but it does not correct for every difference between observations. If you are measuring how often a student follows a direction, the student may receive five directions during one observation and 20 during another. In that situation, the percentage of opportunities completed may tell you more than responses per minute.
Before choosing rate, ask whether time is the variable making the observations unequal. If the real difference is the number of opportunities, tasks, questions, or requests presented, use a measurement that accounts for those opportunities.
Calculating rate data is straightforward, but it can become time-consuming when you are tracking several students or collecting data across multiple weeks. Building spreadsheets, checking formulas, and updating graphs all use planning time that teachers rarely have available.
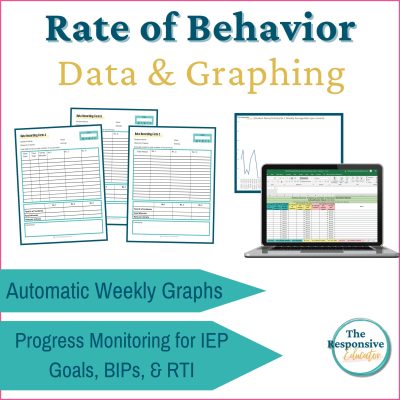
That is why I created my Rate Behavior Tracking Sheet and Graphing System. The resource includes three rate recording forms for different observation situations, automatic rate calculations, editable Excel and Google Sheets graphs, an example graph with trend and phase lines, and step-by-step directions. It also includes a Reinforcement vs. Correction Rate form, which helps teachers examine the balance between positive feedback and corrections in their own classroom interactions.
The resource handles the repeated calculations and graph formatting, but it does not replace the teacher’s judgment. Your knowledge of the student, the setting, and the purpose of the intervention is what gives the data meaning. The forms simply make it easier to spend your time interpreting the information instead of building another spreadsheet.
If you are creating a complete behavior data system, this resource works alongside my Frequency Count, Duration Count, Interval Recording, and ABC Data Collection resources. Because the graphing files use a consistent format, you can change measurement methods as the questions you are asking about a student’s behavior change.
Rate count adds something that frequency count alone cannot provide: time context. When observation periods vary, that context allows you to compare behavior fairly rather than assuming that the larger total always represents more frequent behavior.
The calculation itself is only the beginning. Rate data becomes useful when it helps teachers recognize patterns, explain the classroom impact, evaluate interventions, and decide what support or instruction a student needs next. The number should improve our understanding of the student rather than reduce the student to a number.
The goal is not simply to produce a lower rate. It is to determine whether the support is working and whether the student is developing the skills needed to participate more successfully and independently. Good data helps us make those decisions with greater accuracy, both for the classroom today and for the student’s life beyond school.
When you are ready to turn those calculations into a visual pattern, continue to Rate Graphs: How to Graph and Interpret Behavior Data. The next post explains how to build a rate graph, add meaningful context, and interpret changes without jumping to conclusions.


Support your students’ individual needs with our exclusive Classroom Concerns Checklist.
Identify key concerns in areas like cognitive skills, communication, social/emotional behavior, and more.
Sign up now to receive instant access and valuable insights on addressing classroom concerns.
Don’t miss out, join our community today!

Support your students’ individual needs with our exclusive Classroom Concerns Checklist.
Identify key concerns in areas like:
…and more to help drive collaboration and problem-solving.
Sign up now to receive instant access and valuable insights on addressing classroom concerns.