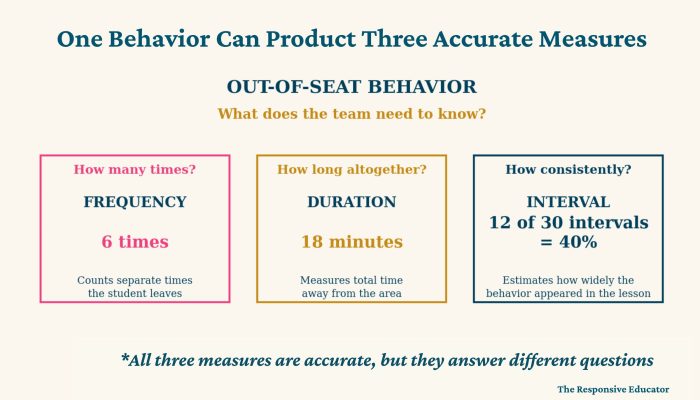
A student leaves their seat six times during a lesson. What should you record?
You could count how many times the student leaves. You could measure how long the student remains away from the assigned area. You could divide the lesson into intervals and record whether the student was out of their seat during each one. All three methods would produce accurate data, but they would not tell you the same thing.
This is where behavior data collection can become confusing. Teachers are often told to collect data on a behavior without being told what information the team actually needs. They know which student behavior is causing concern, but that does not automatically tell them whether to use frequency, rate, duration, or interval recording.
The behavior does not determine the measurement method. The question you need the data to answer does.
In this post, we will walk through behavior data collection examples for common classroom behaviors. For each one, we will consider what a teacher might need to know, which method would answer that question, and what the resulting data would—and would not—communicate.
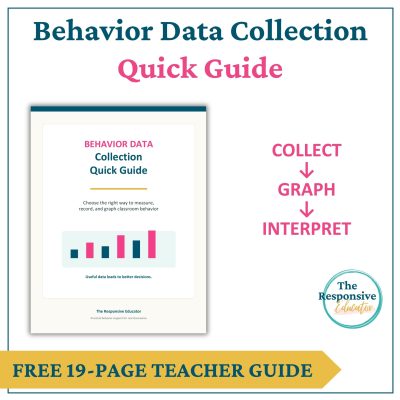
If you would like a resource you can keep nearby while making these decisions, my free Behavior Data Collection Quick Guide walks you through the primary measurement methods, common classroom examples, basic graphing decisions, and mistakes that can make behavior data less useful.
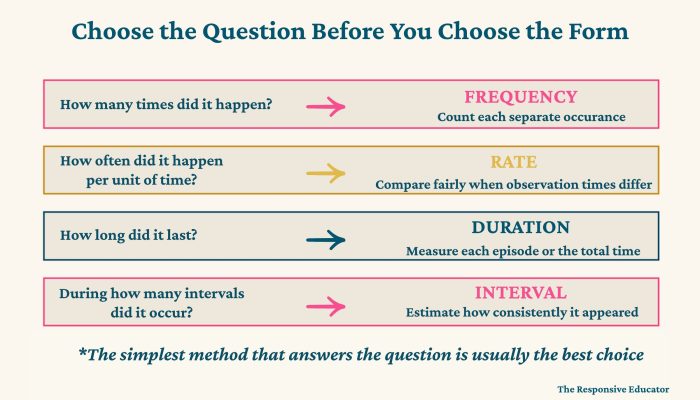
Before choosing a behavior data sheet, think about the decision the data will eventually help you make. Are you trying to determine how many times a behavior occurs? How long it lasts? Whether it happens more often during one activity than another? How consistently a student demonstrates a replacement skill?
The four primary measurement methods in this series answer different questions:
One behavior can be measured in several ways. However, that does not mean you need to collect every kind of data at once. More data is not automatically better data. The goal is to choose the simplest method that still provides the information the teacher or team needs.
If you are not yet sure which of these questions you should be asking, begin with Behavior Data Collection: How to Choose the Right Measurement Method. That article explains what each method measures and when one method is likely to provide a clearer picture than another.
Calling out is usually a discrete behavior with a clear beginning and end, which makes it a strong candidate for frequency recording. Before making the first tally mark, however, you need to define what counts as a call-out.
For example, you might define calling out as speaking without being called on while the teacher or another student has the floor. That definition should also clarify what does not count. A student responding during choral practice, asking for help during independent work, or speaking during an approved group discussion would not necessarily be recorded as calling out.
Without that clarification, one adult may record every comment while another records only interruptions. Both may believe they are collecting frequency data correctly, but their totals will not describe the same behavior.
If you want to know how many times the student calls out during math, use frequency recording and give each call-out one tally mark. For example, your data might show:
The student called out 12 times during a 30-minute math lesson.
That provides a clear count for the observation. Frequency totals can be compared across lessons when the activities and observation periods are reasonably similar. If the lesson lengths differ substantially, rate may provide a fairer comparison.
For a more detailed explanation of when a tally count provides enough information—and when it does not—read Frequency Count: When Is It the Right Choice?
Frequency totals become harder to compare when observation periods vary in length. A student who calls out 10 times during a 20-minute lesson is demonstrating a different rate of behavior than a student who calls out 10 times during a 60-minute lesson.
Consider this example:
At first glance, Tuesday appears to be the more difficult day because it has the higher frequency count. Once the observation time is considered, however, the pattern changes:
The student called out more times on Tuesday but did so at a higher rate on Monday. This is why rate matters when lessons, activities, or observations do not last the same amount of time.
You can learn more about making these comparisons in Rate Count: Comparing Behavior Fairly Across Different Observation Times.
Most individual call-outs last only a few seconds. Timing each one would create more work without necessarily giving you more useful information.
Duration might become relevant if the concern is not separate call-outs but extended talking that continues for several minutes. In that case, the behavior needs to be defined differently. “Calling out” and “talking continuously during instruction” may sound similar, but they are not necessarily the same behavior or the same measurement question.

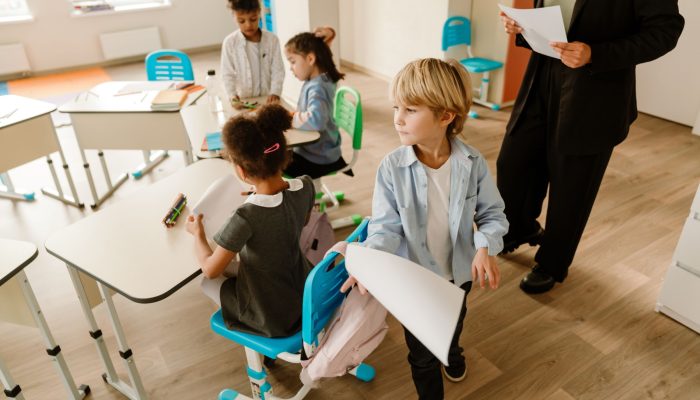
Out-of-seat behavior is one of the clearest examples of why the behavior name alone does not determine the measurement method. Depending on the student and the concern, you may need to know how many times the student leaves, how long the student remains away, or how consistently the behavior occurs throughout a lesson.
Begin with an observable definition. For example:
Out-of-seat behavior occurs when the student’s bottom is no longer touching the assigned chair and the student moves more than two feet from the assigned workspace without permission.
That definition will not fit every classroom or student. A student may have permission to stand while working, access a flexible seating area, retrieve materials independently, or take movement breaks. The definition should reflect the actual expectation rather than treating all movement as a problem.
Use frequency recording when you need to know how many separate times the student leaves the assigned area and each occurrence has a clear beginning and end. Give the student one tally each time the defined behavior occurs. For example:
The student left the assigned area six times during a 30-minute independent-work period.
This tells you how often the student left, but it does not show whether each occurrence lasted five seconds or five minutes. If the amount of time away from instruction is important, duration data may provide a clearer picture.
If the amount of time away is important, duration may provide a clearer picture. Consider two students who each leave their seats four times:
The frequency is the same, but the effect on instruction and task completion may be very different. Duration captures information that four tally marks cannot.
If you need to know how long a behavior lasts or how much total time it consumes, Duration Count: Measuring How Long a Behavior Lasts explains how to define the beginning and end of an episode and calculate meaningful duration data.
Interval recording may be more manageable when a student moves in and out of the assigned area so frequently that counting every occurrence becomes difficult. You might divide a 30-minute lesson into one-minute intervals and record whether the student was out of the assigned area during each interval.
Suppose the student was out of the assigned area during 12 of 30 intervals. You would report that the behavior occurred during 40% of the observed intervals.
This does not necessarily mean that the student spent exactly 40% of the lesson out of their seat. Interval recording estimates how consistently a behavior occurred across the observation. The meaning of the percentage depends on whether you used partial interval or whole interval recording.
If you are deciding between those methods, Partial Interval Recording vs. Whole Interval Recording: Which Should You Use? explains what each method captures and how each one can affect the resulting percentage.
Teachers sometimes try to collect frequency data on off-task behavior, but off-task behavior often does not occur as a series of neat, separate events. A student may look away from the assignment, begin working again, play with a pencil, write one response, watch another student, and then return to the task.
Trying to count every change can quickly become unrealistic, especially when the person collecting data is also responsible for instruction. Interval recording is usually a better fit because it allows the observer to sample what is happening throughout the lesson.
Before collecting data, define what on-task behavior looks like for the activity. During independent writing, it might include looking at the paper or approved reference materials, writing, typing, reading directions, or asking a task-related question. During a teacher-led lesson, the definition would need to look different.
With whole interval recording, the student must remain on task for the entire interval for that interval to be scored as on task. This can be useful when the question is whether the student sustains engagement. For example, you might observe the student during twenty 30-second intervals. If the student remains on task for the entirety of 13 intervals, the recorded percentage would be:
13 ÷ 20 = 65% of whole intervals on task
Whole interval recording tends to underestimate behavior because the student receives credit only when the behavior lasts for the entire interval. A student who works for 25 seconds and looks away for the final five seconds would not receive credit for that interval.
With partial interval recording, you record the behavior if it occurs at any point during the interval. This can be useful when you are measuring whether off-task behavior occurred during each segment of the observation.
If off-task behavior occurred at some point during 8 of 20 intervals, you would report:
Off-task behavior occurred during 40% of the observed intervals.
Partial interval recording tends to overestimate behavior because even a brief occurrence causes the entire interval to be scored. If the student was off task for only two seconds, that interval would still be marked as containing off-task behavior.
Neither percentage should be presented as an exact measure of time. The graph and written summary should identify the interval method used so that anyone reviewing the data understands what the percentage represents. Behavior Interval Chart: How to Graph and Interpret Your Data explains how to display these percentages without losing the context of how they were collected.

Words such as tantrum, meltdown, and emotional escalation can mean very different things to different adults. Before deciding what to measure, describe what an episode looks like for the particular student.
An operational definition might identify observable behaviors such as crying, yelling above a conversational volume, dropping to the floor, pushing materials away, or refusing to move from an area. Avoid definitions such as “trying to get attention,” “becoming manipulative,” or “getting out of work.” Those statements may describe an adult’s interpretation of the behavior, but they do not tell another observer what to record.
It is also important to decide when an episode begins and ends. If a student stops crying for 30 seconds and then begins again, will that be considered a new episode or a continuation of the first one? The answer can vary, but the adults collecting data need to use the same rule.
Frequency can answer how many episodes occurred during a particular day or week. For example:
The student experienced three episodes of emotional escalation during the school week.
That count is accurate, but it may not communicate the full effect of the behavior. Three episodes lasting two minutes each would create a very different picture from three episodes lasting 45 minutes each.
Duration is often essential when episodes continue for extended periods. Suppose your data shows:
The frequency count is three episodes. The total duration is 135 minutes. Neither measurement is wrong. The frequency tells you how many episodes occurred, while the duration communicates how much time the student spent in escalation. Depending on the team’s question, you may decide to record both.
Duration data may include:
You do not need to report every calculation simply because you collected the information. Choose the summary that most clearly communicates what happened.
A frequency or duration total does not communicate the intensity or safety implications of an episode. Two events may last the same amount of time while requiring very different levels of adult support.
When safety is involved, follow the student’s plan and your school’s documentation procedures. Data collection should never require allowing unsafe behavior to continue or delaying an appropriate response simply to obtain a more complete measurement.
Aggression is typically measured with frequency because behaviors such as hitting, kicking, biting, or throwing an object at another person can usually be counted as separate events. However, the definition must be specific enough for staff members to apply it consistently. For example:
Physical aggression is any instance of the student hitting, kicking, biting, scratching, or using an object to make forceful contact with another person.
The definition should clarify how separate occurrences will be counted. If a student strikes another person three times in rapid succession, will that be recorded as three instances or one episode? Either choice can work, but the team must make the decision before collecting data.
Frequency may be sufficient when you are comparing the same school period across several days because the activity and observation time remain consistent. For example, your data might show:
Physical aggression occurred four times during a 30-minute recess period.
If each observation covers the same 30-minute recess period, the daily totals can be compared directly without calculating a rate.
Rate is more useful when the amount of time observed changes. Imagine that the student demonstrated:
The second observation has the higher frequency count, but the first has the higher rate:
The rate does not make the behavior less serious. It simply provides a fairer comparison of how often the behavior occurred relative to the time observed. As with emotional escalation, safety takes priority over obtaining a perfect data sample. Respond according to the student’s plan and school procedures first, then document the observable information available.
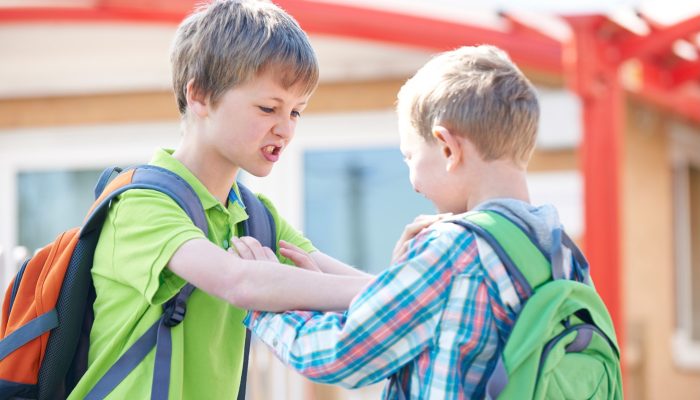
“Work refusal” can describe several different observable behaviors. One student may say, “No,” when given an assignment. Another may sit quietly without beginning. A third may push the paper away, put their head down, or leave the area.
If those behaviors are grouped together without a clear definition, the data may be difficult to interpret. Instead of beginning with the label refusal, identify what the student actually does and what question you need to answer.
This distinction matters because the student who verbally refuses but begins 30 seconds later is not demonstrating the same pattern as the student who says nothing and remains disengaged for 25 minutes.
Frequency may be useful if you are counting a discrete response such as verbally refusing a direction or pushing an assignment away. For example:
The student verbally refused four instructional directions during the school day.
This works only if the refusal response has a clear beginning and end. It would not capture how long the student remained disengaged after each refusal.
Duration may be more useful when the concern is the amount of instructional time that passes without the student working. Your data might show:
Following the independent writing direction, the student remained disengaged for 18 minutes.
To collect that information accurately, define when the period begins and ends. Does it begin when the direction is given, when materials are presented, or after the teacher confirms that the student understood the task? Does it end when the student picks up a pencil, writes the first response, or works continuously for a specified amount of time? Those decisions should be made before the observation begins rather than after the data has been collected.
If the question is how long it takes the student to begin after a direction is given, the teacher is technically measuring latency. Latency is the amount of time between a specific event and the beginning of the behavior. For example:
The teacher gave the direction at 10:02. The student began writing at 10:09. The latency to begin the task was seven minutes.
Latency is not one of the four primary methods emphasized in this series because classroom teachers use it less often. However, it is useful to recognize the term when delayed task initiation is the specific concern.

Elopement is more serious than ordinary out-of-seat behavior because it involves leaving an assigned or supervised area. The operational definition should identify the boundary the student crosses and what counts as a separate occurrence. For example:
Elopement occurs when the student moves through the classroom doorway or more than ten feet away from the assigned group without adult permission.
This is more precise than writing that the student “ran away” or “tried to escape.”
Use frequency recording when the team needs to know how many separate elopement incidents occurred. Give one tally each time the student crosses the boundary identified in the operational definition. For example, your data might show:
The student left the supervised area twice during the school day.
That count can help the team examine whether the number of incidents is increasing, decreasing, or remaining stable across days or weeks.
Duration answers how long the student remained outside the supervised area. Two incidents on the same day might look like this:
The frequency count is two, but the duration provides important additional context. Depending on the situation, the location, distance traveled, staff response, and safety concerns may also need to be documented according to school procedures. Again, data collection never takes priority over student or staff safety.
Repetitive movements, scripting, and vocalizations vary widely. Some occur as brief, distinct events that can be counted. Others happen so frequently or continuously that attempting to count every occurrence would not be realistic. This is another situation in which the teacher must define the observable behavior before choosing the method.
When each repetitive behavior has a clear beginning and end, frequency can be used to count the individual occurrences. For example, your data might show:
The student repeated the same phrase nine times during a 30-minute lesson.
Frequency totals work well when the observation periods are similar. If lesson lengths vary, calculate a rate so the observations can be compared fairly. The same data could be reported as approximately three repetitive vocalizations per 10 minutes.
The definition should make it possible to distinguish one occurrence from the next. If the behavior is nearly continuous, trying to separate it into individual events may create unreliable data.
If the behavior occurs too rapidly or continuously to count accurately, interval recording may be more practical. Divide the observation into equal intervals and record whether the behavior occurred during each interval. For example:
Repetitive vocalizations occurred during 14 of 20 intervals, or 70% of the observed intervals.
That percentage describes how consistently the behavior appeared across the observation. It does not provide an exact frequency or tell you that the student vocalized for 70% of the total time.
The behavior may also serve an important regulatory, communication, or sensory purpose for the student. Collecting data does not automatically mean the goal should be to eliminate it. The team still needs to consider whether the behavior is harmful, prevents access to instruction, interferes with communication, or can be supported in a less restrictive way.
If you want a quick way to remember which method answers each question, use this Quick Reference for Choosing the Right Behavior Measurement Method. It can help you decide whether frequency, rate, duration, or interval recording will provide the clearest information.
Understanding the definitions of the measurement methods is important, but the quality of the data also depends on the decisions made before and during the observation.
A data sheet is only useful when it collects the information you need. Beginning with an available form and trying to make the behavior fit it can result in accurate numbers that do not answer the team’s question. Start by identifying what you need to know. Then choose or create the form.
Labels such as noncompliance, disrespect, tantrum, and off task can mean different things to different observers. Data will be more reliable when the behavior is described using actions that can be seen or heard.
Instead of writing “The student was disrespectful three times,” identify whether the student yelled, used a specific type of language, refused a direction, walked away, or engaged in another observable action.
A higher count does not always mean the behavior occurred at a higher rate. If one observation lasted twice as long as another, you would expect more opportunities for the behavior to occur.
Use rate when observation periods differ substantially.
If a behavior occurred during 60% of partial intervals, that does not mean it lasted for exactly 60% of the observation. Partial interval data can overestimate behavior, while whole interval data can underestimate it.
Always identify the interval method and interpret the percentage accordingly.
The most detailed system is not automatically the best one. A complicated form that is completed inconsistently will usually provide less useful information than a simpler method that staff can use accurately.
Choose the least complicated method that still answers the question.
One observation provides a snapshot. Repeated observations allow teachers and teams to see whether a behavior is increasing, decreasing, or remaining relatively stable.
A behavior graph can make those patterns easier to recognize. It can help a team compare baseline data with information collected after a support is introduced, communicate progress during meetings, and recognize when an approach may need to be reconsidered.
The graph must match the measurement method. Frequency belongs on a frequency graph, rate data should remain a rate, duration should retain its unit of time, and interval data should be displayed as a percentage of intervals. Mixing measurement types or changing the unit without explaining it can make the pattern harder to interpret.
Once the data has been collected, these articles explain how to graph and interpret each type:
Choose the article that matches the type of data you collected to learn how to graph it accurately and interpret the pattern over time.
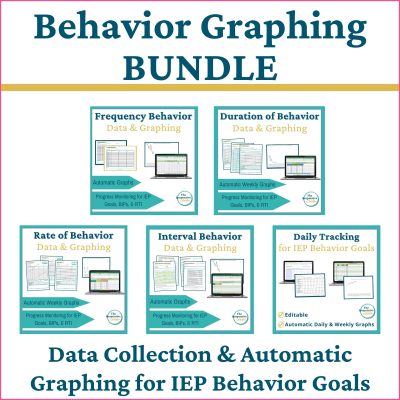
If you need help collecting and graphing more than one type of behavior data, my Behavior Data Collection and Graphing Bundle brings the frequency, rate, duration, and interval tools together. The individual resources are also available if you only need support with one measurement method.
Frequency, rate, duration, and interval data tell you how much behavior occurred. They do not necessarily explain why it may be happening.
Suppose your data shows that a student left the assigned area seven times, spent 24 total minutes away, and was out of the area during 35% of the observed intervals. You now have a much clearer description of the behavior, but you may still not understand the pattern surrounding it.
If the next question is whether the behavior is connected to particular tasks, settings, interactions, or adult responses, you need a different type of information. ABC data records what happened before the behavior, the observable behavior itself, and what happened immediately afterward.
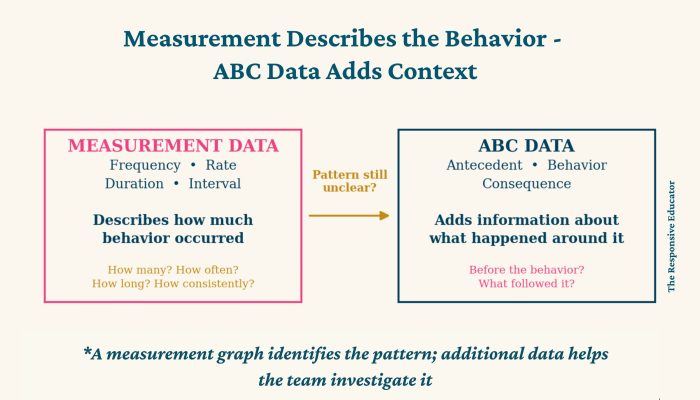
In schools, ABC data is often collected as one source of information within a Functional Behavior Assessment or another structured team process. A classroom teacher may be asked to collect it, but that does not mean the teacher is expected to determine the function of behavior or conduct an FBA independently.
The next post, ABC Behavior Explained: Understanding Antecedents, Behaviors, and Consequences, will explain what ABC data captures, what it can help a team notice, and how it differs from the measurement methods covered in this series.
There is no single correct way to measure calling out, out-of-seat behavior, emotional escalation, work refusal, or most other classroom concerns. The best method depends on what you need the data to communicate.
Frequency tells you how many times the behavior occurred. Rate allows you to compare behavior across different amounts of observation time. Duration shows how long the behavior lasted. Interval recording shows how consistently it occurred across an observation.
Good behavior data does more than produce a number. It helps another teacher, specialist, administrator, or family member understand what has been happening without relying on vague descriptions or memory. It also gives the team a clearer way to recognize whether a student is making meaningful progress over time.
Before making the first tally mark, ask yourself, “What question do I need this data to answer?” Once that question is clear, choosing the measurement method becomes much easier—and the information you collect is far more likely to help the team understand and support the student.


Support your students’ individual needs with our exclusive Classroom Concerns Checklist.
Identify key concerns in areas like cognitive skills, communication, social/emotional behavior, and more.
Sign up now to receive instant access and valuable insights on addressing classroom concerns.
Don’t miss out, join our community today!
Text

Support your students’ individual needs with our exclusive Classroom Concerns Checklist.
Identify key concerns in areas like:
…and more to help drive collaboration and problem-solving.
Sign up now to receive instant access and valuable insights on addressing classroom concerns.